Comparative Study
. 2015 May;1850(5):1059-1071.
doi: 10.1016/j.bbagen.2014.09.018. Epub 2014 Sep 26.

All-atom crystal simulations of DNA and RNA duplexes

Affiliations
Comparative Study

All-atom crystal simulations of DNA and RNA duplexes

Chunmei Liu et al. Biochim Biophys Acta. 2015 May.

Abstract

Background: Molecular dynamics simulations can complement experimental measures of structure and dynamics of biomolecules. The quality of such simulations can be tested by comparisons to models refined against experimental crystallographic data.

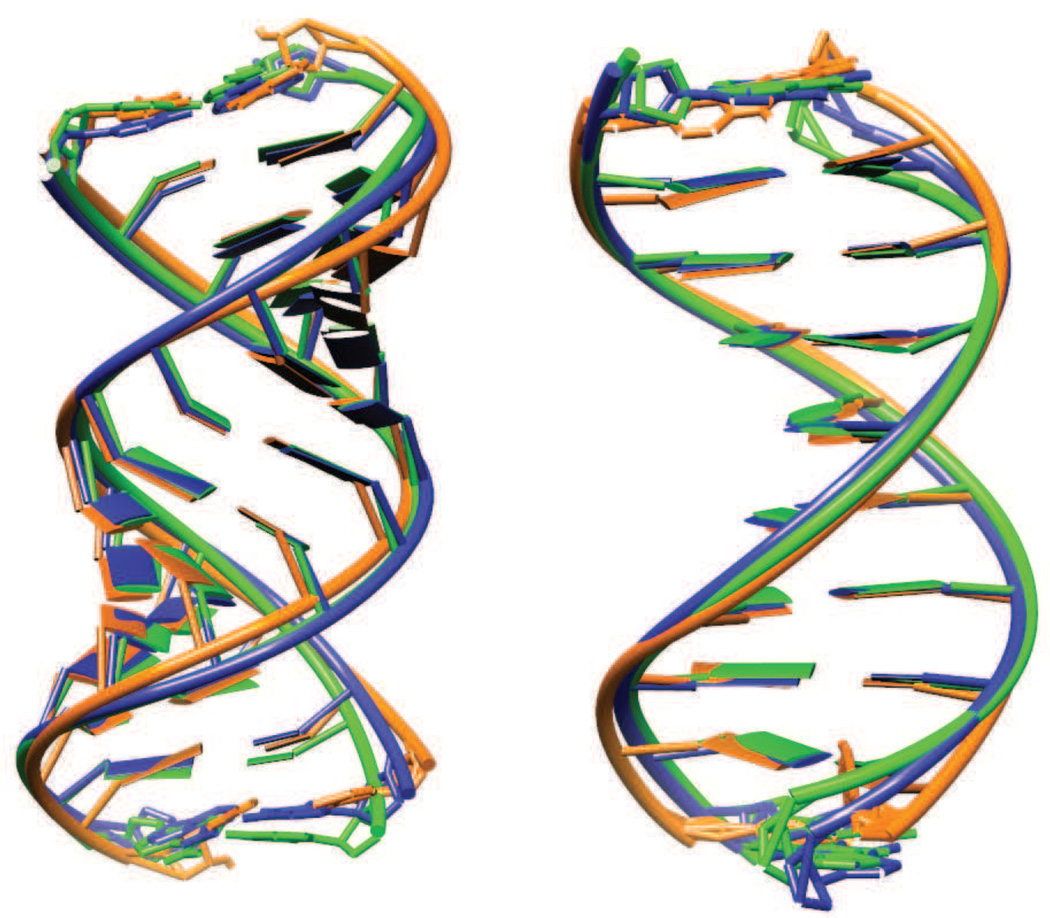
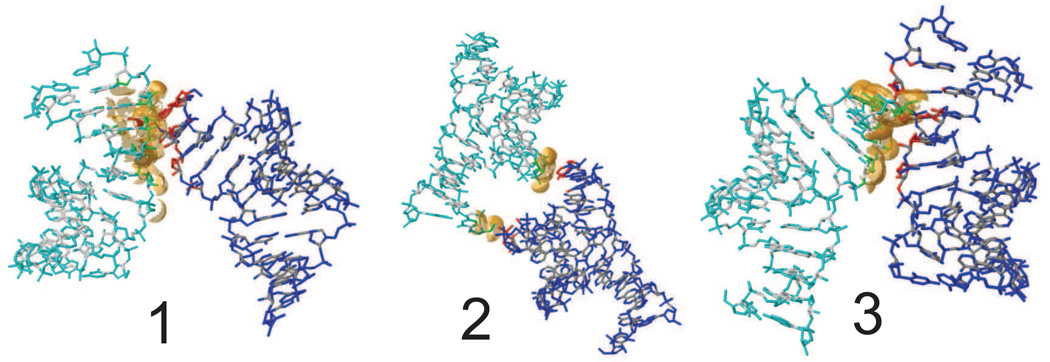
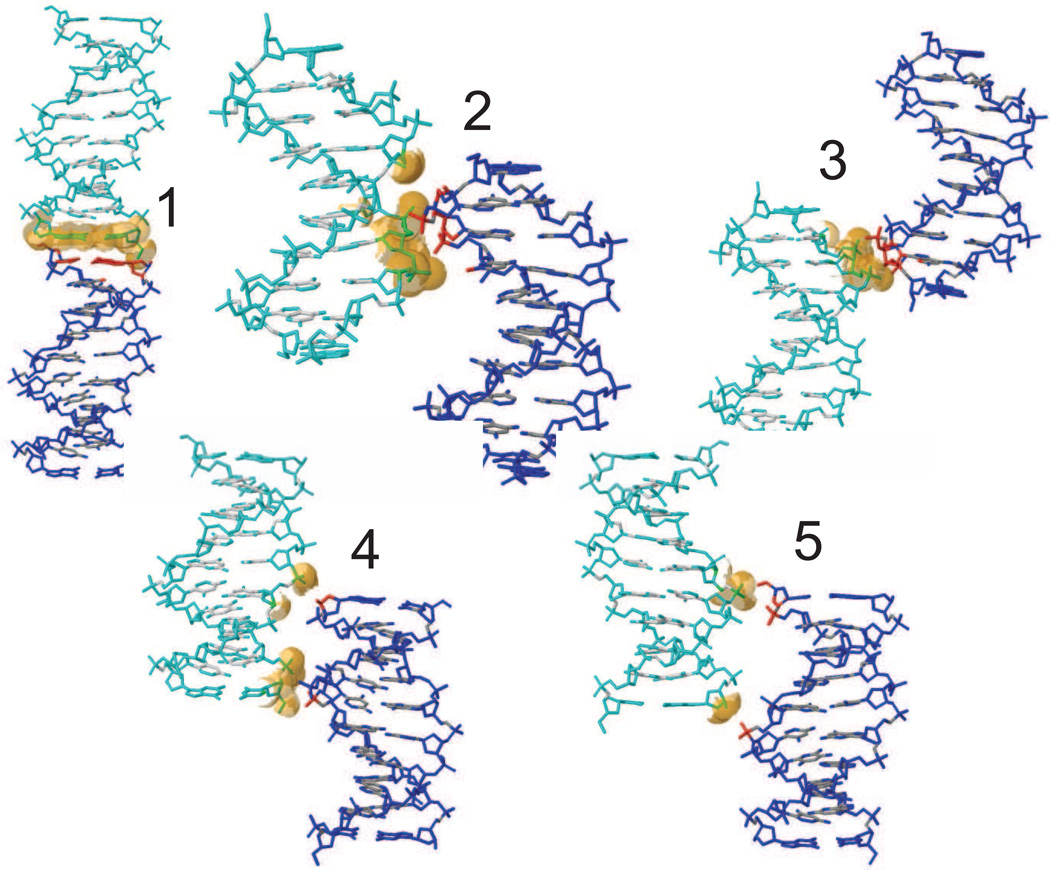
Methods: We report simulations of DNA and RNA duplexes in their crystalline environment. The calculations mimic the conditions for PDB entries 1D23 [d(CGATCGATCG)2] and 1RNA [(UUAUAUAUAUAUAA)2], and contain 8 unit cells, each with 4 copies of the Watson-Crick duplex; this yields in aggregate 64μs of duplex sampling for DNA and 16μs for RNA.

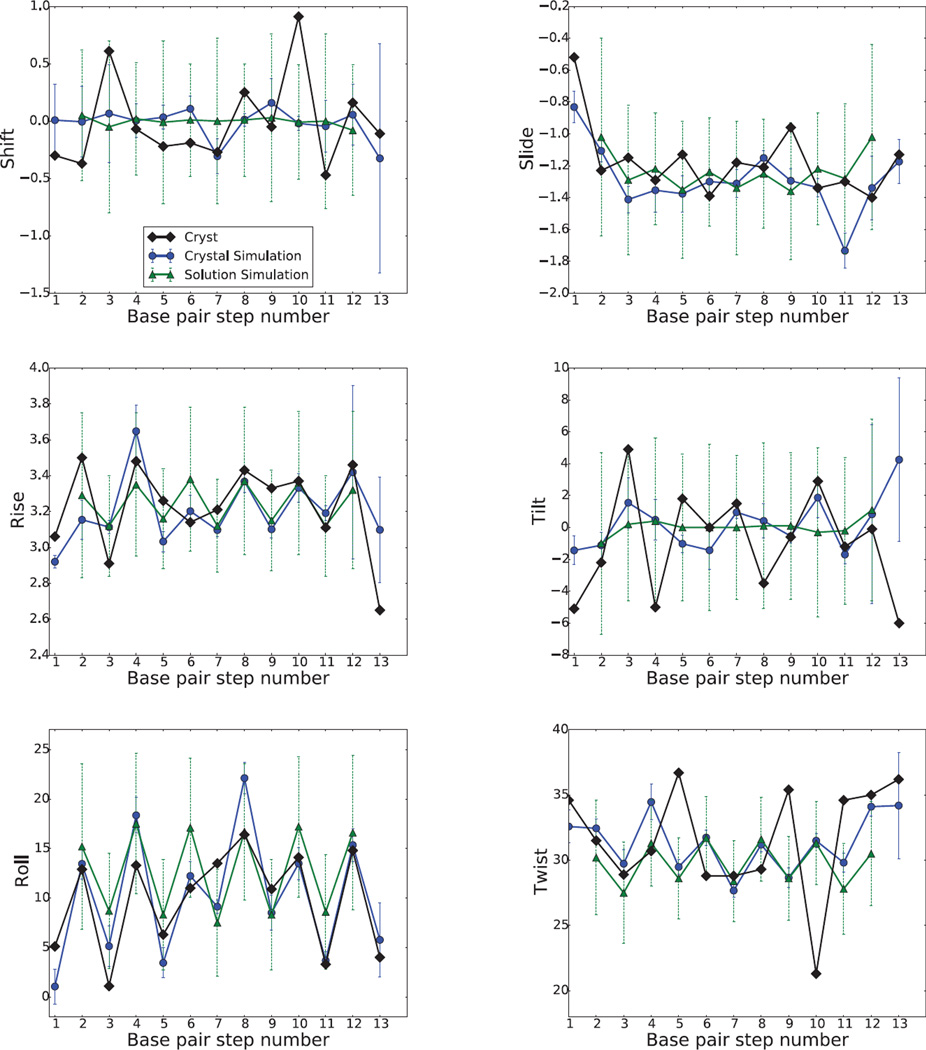
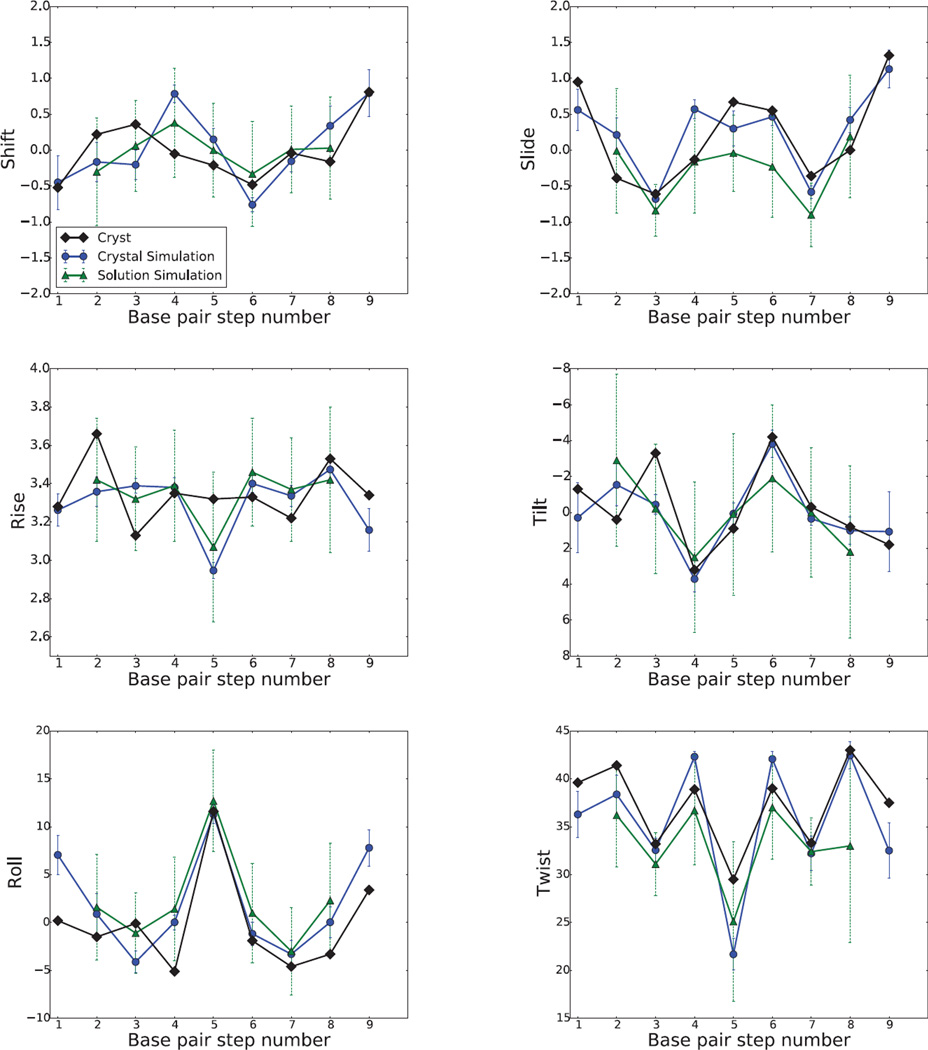
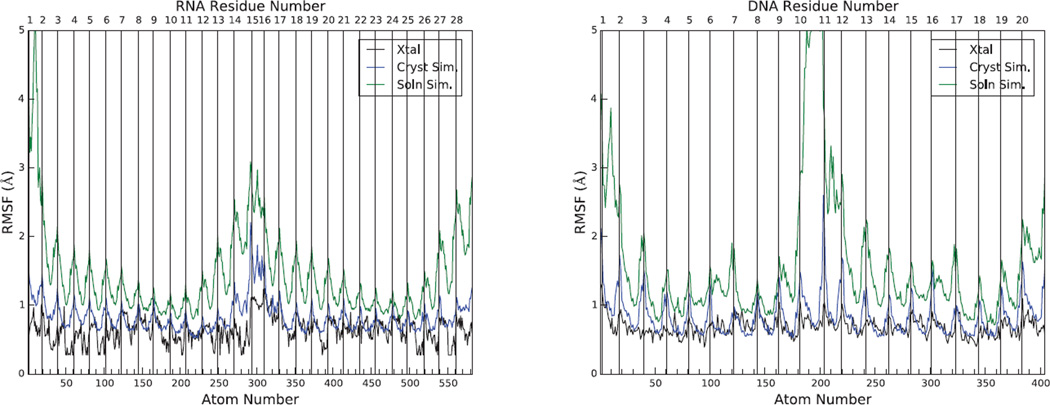
Results: The duplex structures conform much more closely to the average structure seen in the crystal than do structures extracted from a solution simulation with the same force field. Sequence-dependent variations in helical parameters, and in groove widths, are largely maintained in the crystal structure, but are smoothed out in solution. However, the integrity of the crystal lattice is slowly degraded in both simulations, with the result that the interfaces between chains become heterogeneous. This problem is more severe for the DNA crystal, which has fewer inter-chain hydrogen bond contacts than does the RNA crystal.

Conclusions: Crystal simulations using current force fields reproduce many features of observed crystal structures, but suffer from a gradual degradation of the integrity of the crystal lattice.

General significance: The results offer insights into force-field simulations that test their ability to preserve weak interactions between chains, which will be of importance also in non-crystalline applications that involve binding and recognition. This article is part of a Special Issue entitled Recent developments of molecular dynamics.

Keywords: Crystal; Molecular dynamics; Nucleic acids.


Figures

Figure 1
Figure 1
Two three dimension views of the RNA (left) and DNA (right) packing in supercells. The supercell contains 8 unit cells in a 2 × 2 × 2 arrangement; each unit cell comprises four RNA/DNA molecules. The cyan box is unit cell.
Figure 2
Figure 2
Positional RMSDs of all heavy atoms for RNA and DNA relative to the initial X-ray structure in the course of simulation.
Figure 3
Figure 3
Superpositions of the solution average structure (orange) and the best-fit average structure (blue) for RNA (left) and DNA (right) versus the deposited crystal structures (green).
Figure 4
Figure 4
Plots of major-groove width for RNA and minor-groove width for DNA in crystal and solution simulations. Widths in Å are defined by the distance between the phosphate atoms shown at the top and bottom. Vertical bars give the standard deviations of the fluctuations seen in the simulations.
Figure 5
Figure 5
Conformational substates (BII) probability in the crystal and solution simulation along the sequence: P2 to P10 are in strand 1, P12 to P20 are in strand 2. In the crystal configuration, P2, P7, P12, P17 have a BII conformation, and all others have a BI conformation.
Figure 6
Figure 6
RNA base pair step parameters, translational parameters are in angstroms (Å) and rotational parameters are in degrees (°).
Figure 7
Figure 7
DNA base pair step parameters, translational parameters are in angstroms (Å) and rotational parameters are in degrees (°).
Figure 8
Figure 8
Root-mean-square fluctuations as function of heavy atom number for RNA (left) and DNA (right). The left half of each figure represents chain A, and the right half, chain B. Light vertical lines identify the phosphate atoms (excluding residues U1A15 for RNA and C1C11 for DNA). B-factors in 1RNA/1D23 (PDB entry) were converted to fluctuations using Eq. 1.
Figure 9
Figure 9
Lattice contacts, showing the orientation of one RNA asymmetric unit relative to its neighbors. The contacts are shown as defined by PISA (Proteins, Interfaces, Structures and Assemblies; http://www.ebi.ac.uk/pdbe/pisa/).
Figure 10
Figure 10
The average distances of O3’/A14_O2’/U4 and O2/U15_O2’/A25 for the 32 duplexes in RNA supercell for interface 2. (Red lines are standard deviations, blue lines are the distance in crystal structure, black bars give the average distances for every duplex.)
Figure 11
Figure 11
Distances of center of mass between the interface residues for RNA, for each of the 32 copies of each interface. Black lines show the value from the X-ray structure. Bold blue lines are the average distances between interface centers of mass.
Figure 12
Figure 12
Same as Fig. 9, but for DNA.
Figure 13
Figure 13
Cartoon view of the 1D23 crystal structure, showing the two identified Mg2+ ions as green spheres with attached water molecules (smaller red spheres). The mesh structure shows the Mg2+ distribution from the simulation.
Figure 14
Figure 14
Distances between the centers of mass between the interface residues for DNA. Black lines show the value from the X-ray structure. Bold blue lines are the average distances between interface centers of mass.
Figure 15
Figure 15
The center of mass position for each of the 32 duplexes, where the origin represents their position in an ideal lattice.

References

    1. Kim HS, Mhin BJ, Yoon CW, Wang CX, Kim KS. A theoretical study of a Z-DNA crystal: Structure of counterions, water and DNA molecules. Bull. Korean Chem. Soc. 1991;12:214–219.
    1. MacKerell AD, Jr, Wiórkiewicz-Kuczera J, Karplus M. An all-atom empirical energy function for the simulation of nucleic acids. J. Am. Chem. Soc. 1995;117:11946–11975.
    1. Cheatham TE, Case DA. Twenty-five years of nucleic acid simulations. Biopolymers. 2013;99:969–977. - PMC - PubMed
    1. Cheatham TE, III, Miller JL, Fox T, Darden TA, Kollman PA. Molecular dynamics simulations on solvated biomolecular systems: The particle mesh Ewald method leads to stable trajectories of DNA, RNA and proteins. J. Am. Chem. Soc. 1995;117:4193–4194.
    1. York DM, Yang W, Lee H, Darden T, Pedersen LG. Toward the accurate modelling of DNA: The importance of long-range electrostatics. J. Am. Chem. Soc. 1995;117:5001–5002.

Publication types

LinkOut - more resources