. 2015 Jun;111(Pt B):142-8.
doi: 10.1016/j.visres.2014.09.007. Epub 2014 Sep 26.

Performance of photovoltaic arrays in-vivo and characteristics of prosthetic vision in animals with retinal degeneration

Affiliations

Performance of photovoltaic arrays in-vivo and characteristics of prosthetic vision in animals with retinal degeneration

Henri Lorach et al. Vision Res. 2015 Jun.

Erratum in

  • Vision Res. 2015 Dec;117():137. Galambos, Ludwig [Added]

Abstract

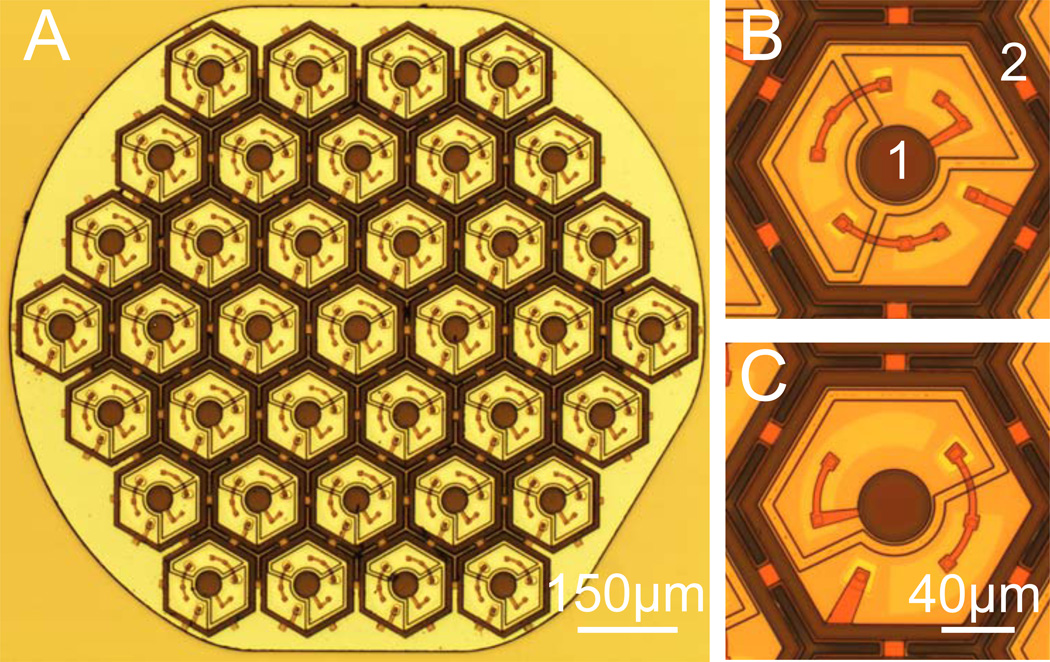
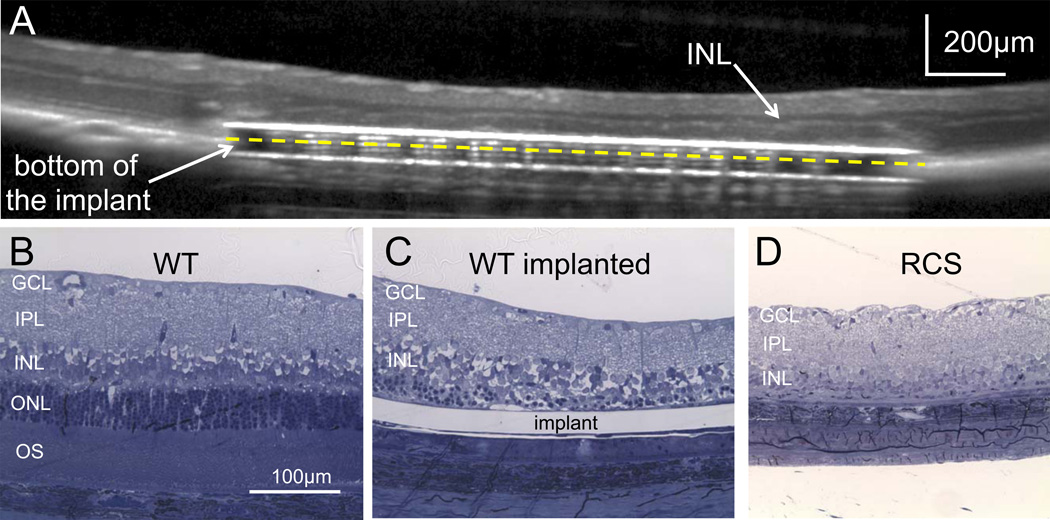
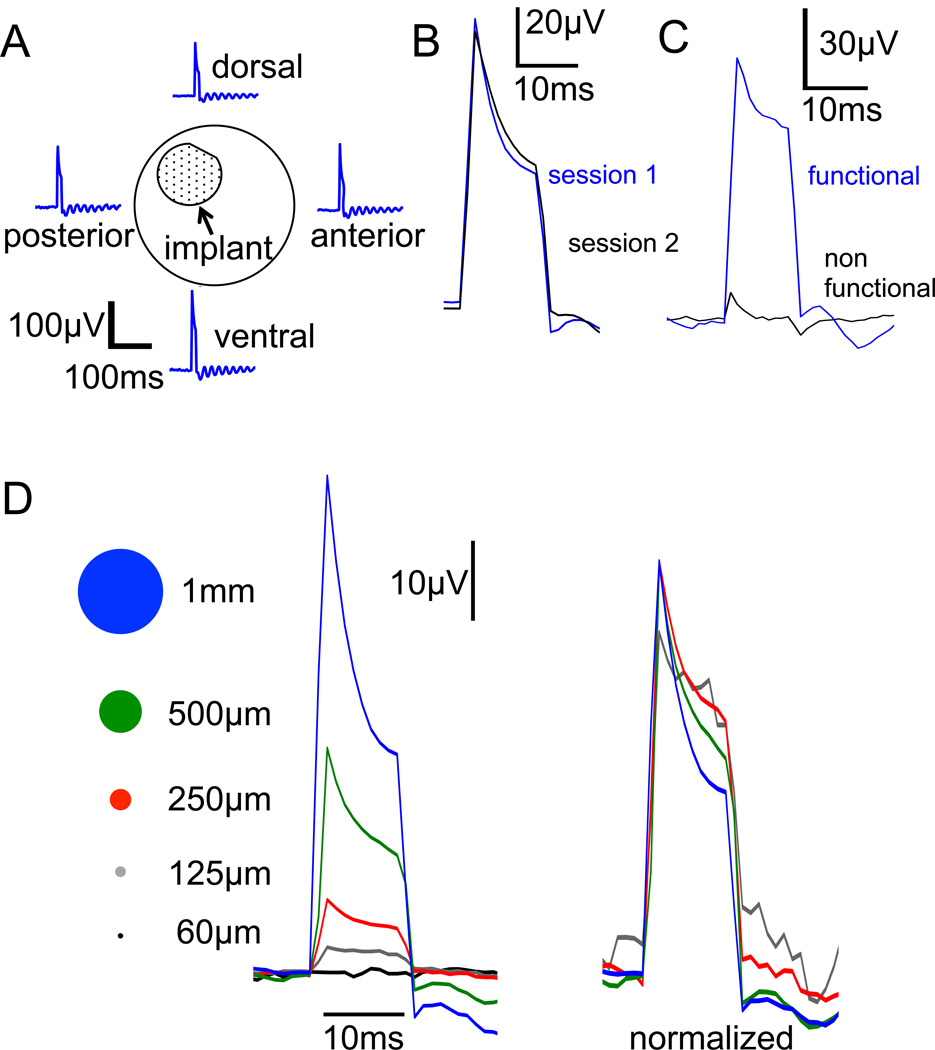
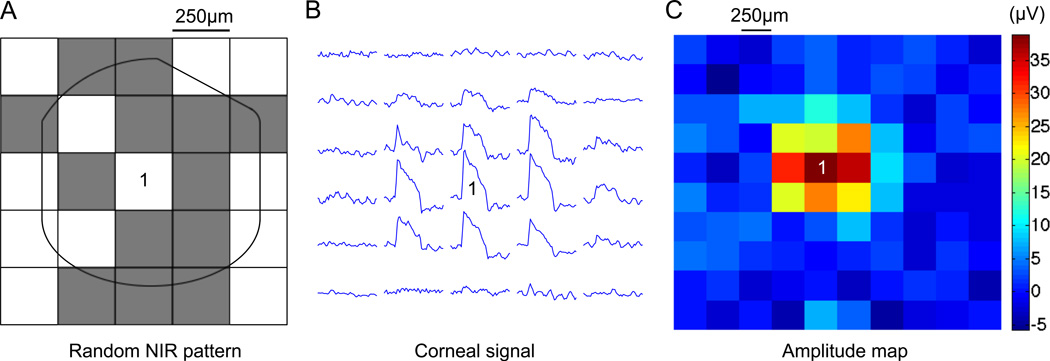
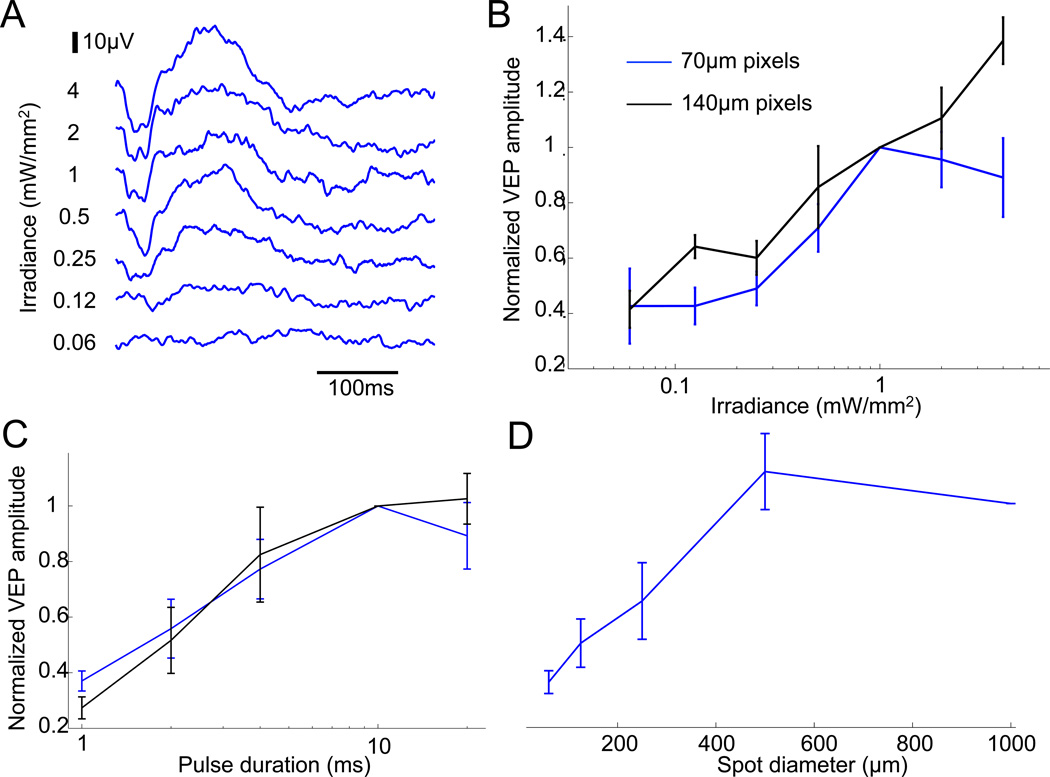
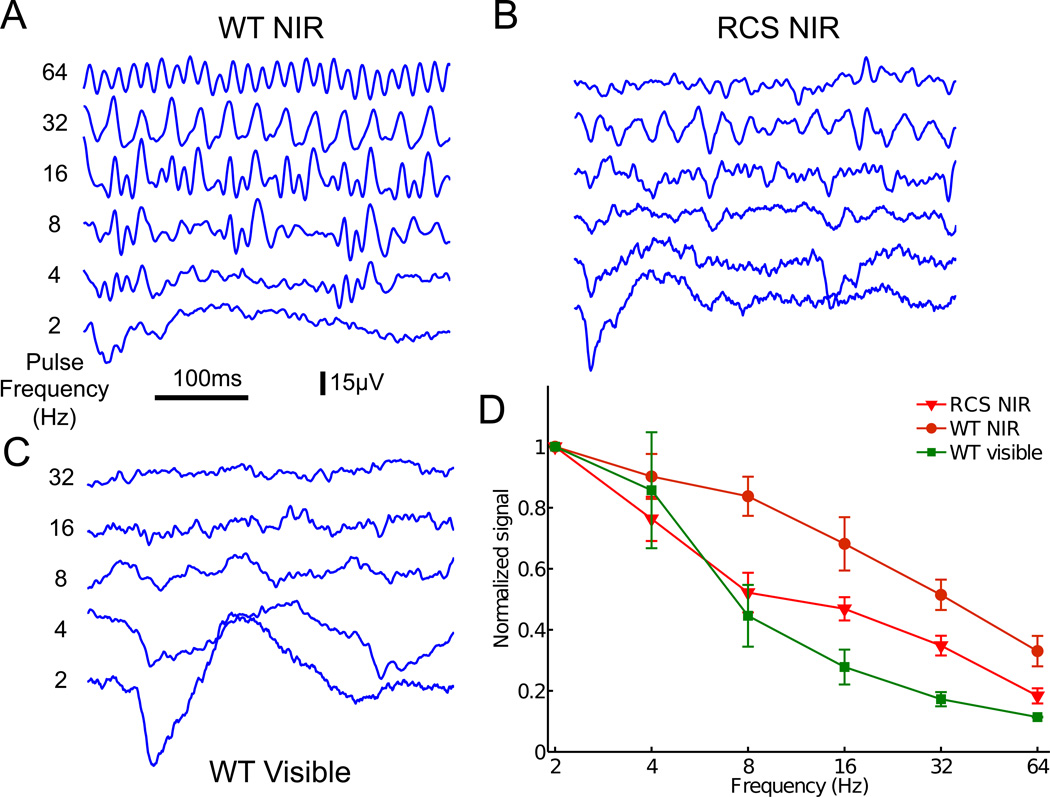
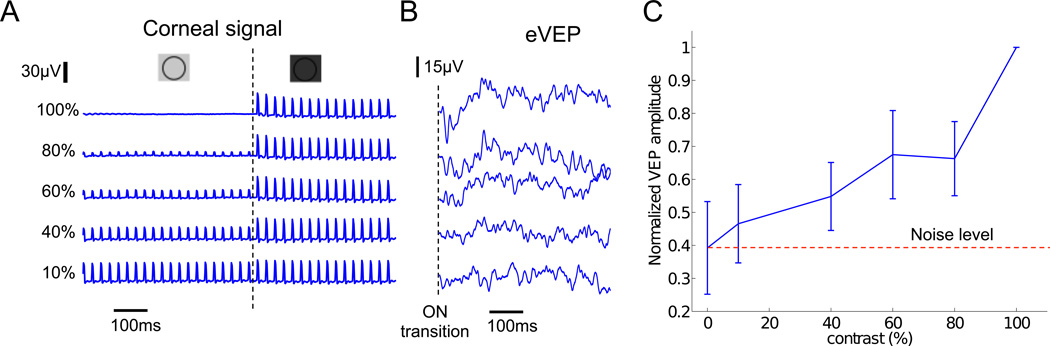
Loss of photoreceptors during retinal degeneration leads to blindness, but information can be reintroduced into the visual system using electrical stimulation of the remaining retinal neurons. Subretinal photovoltaic arrays convert pulsed illumination into pulsed electric current to stimulate the inner retinal neurons. Since required irradiance exceeds the natural luminance levels, an invisible near-infrared (915 nm) light is used to avoid photophobic effects. We characterized the thresholds and dynamic range of cortical responses to prosthetic stimulation with arrays of various pixel sizes and with different number of photodiodes. Stimulation thresholds for devices with 140 μm pixels were approximately half those of 70 μm pixels, and with both pixel sizes, thresholds were lower with 2 diodes than with 3 diodes per pixel. In all cases these thresholds were more than two orders of magnitude below the ocular safety limit. At high stimulation frequencies (>20 Hz), the cortical response exhibited flicker fusion. Over one order of magnitude of dynamic range could be achieved by varying either pulse duration or irradiance. However, contrast sensitivity was very limited. Cortical responses could be detected even with only a few illuminated pixels. Finally, we demonstrate that recording of the corneal electric potential in response to patterned illumination of the subretinal arrays allows monitoring the current produced by each pixel, and thereby assessing the changes in the implant performance over time.

Keywords: Prosthetic vision; Rat; Subretinal implant; Visually evoked potentials.


Figures

Fig. 1
Fig. 1. Photovoltaic arrays
A) Light micrograph of the implant with 140µm pixels (37 pixels total). The 1mm disk-shaped implant has 3 flat facets to help define its orientation (face up or down) during implantation. B) Three-diode pixel composed of the 40µm diameter active electrode (1) and the return electrode ring (2). The 3-diodes are connected in series between the electrodes. C) Two-diode pixel with the same design. The total photodiode area is larger than in the 3-diode device but provides 2/3 of the peak voltage [15].
Fig. 2
Fig. 2. Subretinal implantation triggers local retinal degeneration in WT rats
A) Optical coherence tomography (OCT) image of the implanted eye in a WT animal reveals the subretinal positioning of the prosthesis. The inner retinal layer (INL) is well preserved while the outer retinal layer degenerates above the implant, thus creating a model of local retinal degeneration. B) Histology of the WT retina next to the implanted area showing normal outer segments (OS), outer nuclear layer (ONL), inner nuclear layer (INL), inner plexiform layer (IPL) and ganglion cell layer (GCL). C) Representative histology of the same retina above the implant, showing a loss of photoreceptors five weeks after implantation. However, the inner nuclear layer and ganglion cell layer are preserved. This phenomenon was reproducible in all 3 animals implanted with passive devices. D) Retina of an RCS rat, 10 weeks post-natal, has no outer segments and photoreceptor nuclei, but the inner retina is preserved.
Fig. 3
Fig. 3. Monitoring the subretinal stimuli via corneal electrodes
A) Pulses of electric current (10ms) produced by the implant were recorded by an electrode placed on the cornea. Their amplitude and shape do not change with position of the recording electrode (dorsal, ventral, nasal and temporal recordings are shown here). B) Corneal potential measurements were reproducible in consecutive sessions: waveforms 1 and 2 were recorded one week apart. C) Example of the signal from a dysfunctional 2-diode 140µm pixel device (black line) compared to a normal pixel of the same configuration (blue). This device did not elicit any cortical activity. D) Corneal signal increases with increasing spot size on the retina. With 70µm pixels, the stimulation signal could be detected with a spot size as small as 125µm in diameter, which enables evaluation of a single (or at most two) pixels in the array.
Fig. 4
Fig. 4. Multifocal analysis of the corneal signals
A) Implant activated by a spatiotemporal binary noise pattern to extract signals from various regions of the chip. B) The correlation of the corneal signal with the luminance of each square of the checkerboard pattern allows mapping local contributions of the implant (see Methods). Checkerboard pixel number 1 in panel A generates the associated signal (1). C) Amplitude maps can be drawn to assess the status of the implant in-vivo over time. Here, 250µm checkerboard patterns represent the implant response in-vivo.
Fig. 5
Fig. 5. Modulation of VEP responses by irradiance, duration and spot size
A) Amplitude of the VEP signal is modulated by pulse irradiance from 0.06 to 4mW/mm2, keeping a constant pulse duration of 10ms. B) Devices with 70µm pixels (blue) elicit a VEP response at 0.25mW/mm2, which increases up to 1mW/mm2, and saturates beyond that level. The 140µm pixels (black) have lower thresholds and do not saturate at high irradiance. C) VEP amplitude increases with pulse duration between 1 and 10ms, and saturates with longer pulses (with 2 and 4mW/mm2 irradiance for 140µm and 70µm pixel devices, respectively). D) VEP amplitude increases with larger spot sizes on the implant, and saturates beyond 500µm. Response can be detected with a spot diameter as small as 125µm.
Fig. 6
Fig. 6. Frequency dependence
A–B) Cortical responses to NIR stimulation at various frequencies in WT (A) and RCS (B) rats. C) Responses to a similar stimulation protocol by visible light in a WT animal. D) VEP amplitude decreases with increasing frequency of NIR stimulation in WT and RCS rats, similarly to the natural visible light response. However, in WT rats, the cortical activity elicited by the implant follows higher frequencies than in RCS rats.
Fig. 7
Fig. 7. Contrast sensitivity with prosthetic stimulation
A) Irradiance contrast was varied in steps every 500ms, with 4ms pulses applied at 40Hz. The corresponding waveforms were recorded on the cornea. B) VEP responses to various steps of contrast. C) VEP amplitude increases with increasing contrast, but only 100% contrast elicited responses statistically different from the noise level.

References

    1. Humayun MS, et al. Preliminary 6 month results from the argus™ II epiretinal prosthesis feasibility study, in Engineering in Medicine and Biology Society, 2009; Annual International Conference of the IEEE; 2009. pp. 4566–4568. - PMC - PubMed
    1. Humayun MS, et al. Interim Results from the International Trial of Second Sight's Visual Prosthesis. Ophthalmology. 2012;119(4):779–788. - PMC - PubMed
    1. Zrenner E, et al. Subretinal electronic chips allow blind patients to read letters and combine them to words. Proceedings of the Royal Society B: Biological Sciences. 2010 - PMC - PubMed
    1. Zrenner E. Fighting Blindness with Microelectronics. Science Translational Medicine. 2013;5(210):210ps16. - PubMed
    1. Wilke R, et al. Spatial Resolution and Perception of Patterns Mediated by a Subretinal 16-Electrode Array in Patients Blinded by Hereditary Retinal Dystrophies. Investigative Ophthalmology & Visual Science. 2011;52(8):5995–6003. - PubMed

Publication types