. 2014 Nov 24;15(17):2598-2604.
doi: 10.1002/cbic.201402368. Epub 2014 Sep 24.

A fluorimetric readout reporting the kinetics of nucleotide-induced human ribonucleotide reductase oligomerization

Affiliations

A fluorimetric readout reporting the kinetics of nucleotide-induced human ribonucleotide reductase oligomerization

Yuan Fu et al. Chembiochem. .

Abstract

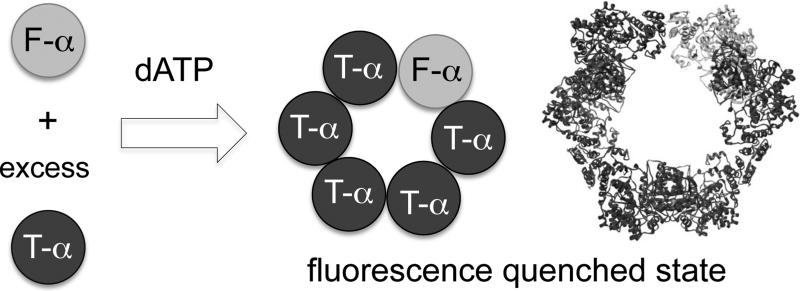
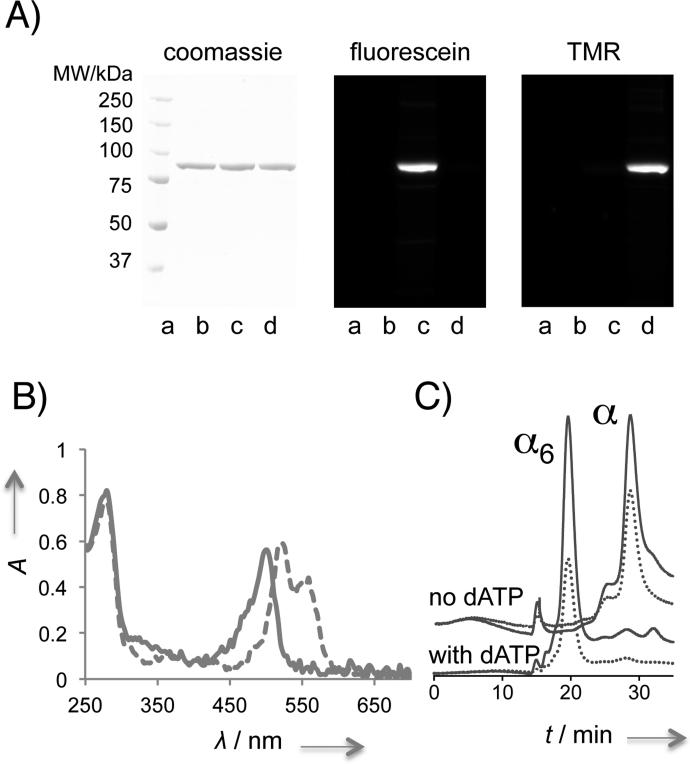
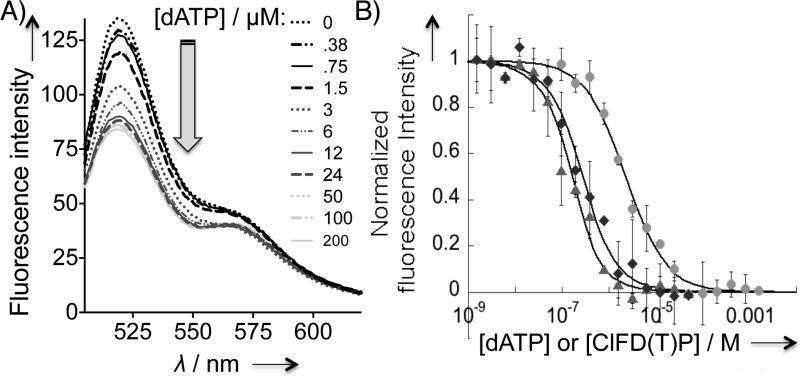
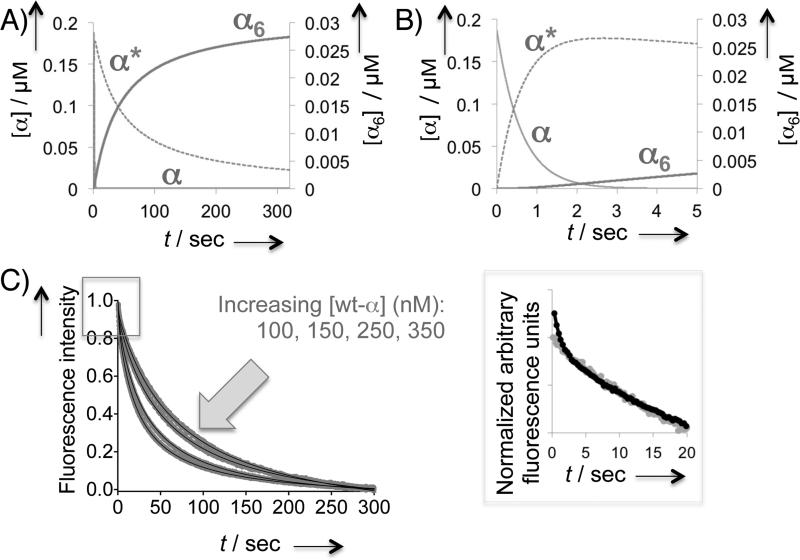
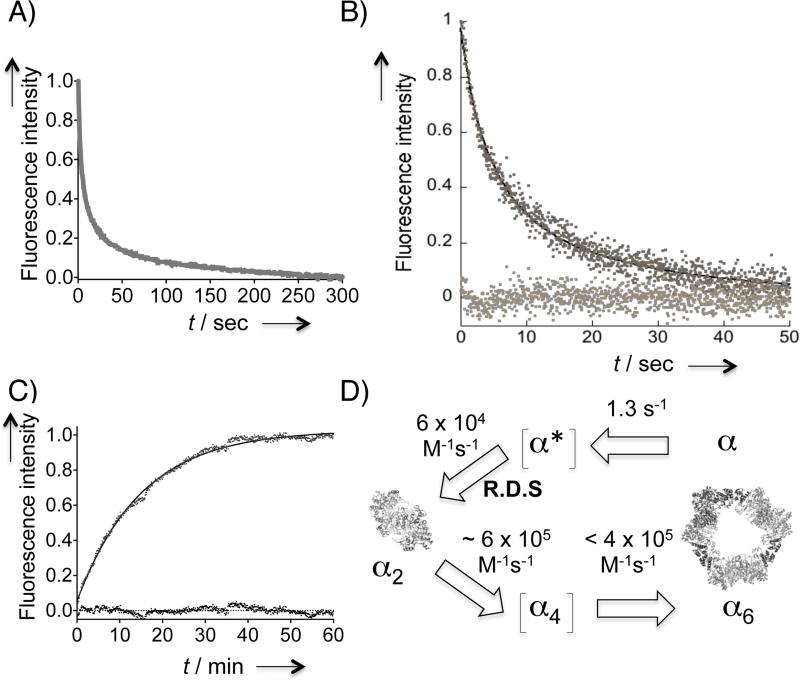
Human ribonucleotide reductase (hRNR) is a target of nucleotide chemotherapeutics in clinical use. The nucleotide-induced oligomeric regulation of hRNR subunit α is increasingly being recognized as an innate and drug-relevant mechanism for enzyme activity modulation. In the presence of negative feedback inhibitor dATP and leukemia drug clofarabine nucleotides, hRNR-α assembles into catalytically inert hexameric complexes, whereas nucleotide effectors that govern substrate specificity typically trigger α-dimerization. Currently, both knowledge of and tools to interrogate the oligomeric assembly pathway of RNR in any species in real time are lacking. We therefore developed a fluorimetric assay that reliably reports on oligomeric state changes of α with high sensitivity. The oligomerization-directed fluorescence quenching of hRNR-α, covalently labeled with two fluorophores, allows for direct readout of hRNR dimeric and hexameric states. We applied the newly developed platform to reveal the timescales of α self-assembly, driven by the feedback regulator dATP. This information is currently unavailable, despite the pharmaceutical relevance of hRNR oligomeric regulation.

Keywords: feedback inhibition; fluorescence reporter assay; human ribonucleotide reductase; oligomeric regulation; stopped-flow kinetics.


Figures

Figure 1
Figure 1
A fluorescence readout directly reporting RNR-α hexamerization. Feedback inhibitor dATP binding at the A site induces assembly of α6 states in which the donor fluorescein signal is quenched. Gray and dark spheres are fluorescein (F)- and tetramethylrhodamine (T)-labeled α monomers. Hexamers with all T-α are omitted for clarity. The ribbon represents the known 6.6 Å crystal structure of dATP-bound α6 from S. cerevisiae (3PAW).
Figure 2
Figure 2
The covalent fluorophore labeling strategy is non-intrusive to α oligomerization. A) In-gel fluorescence analysis using denaturing SDS-PAGE validates covalent fluorophore labeling. Lane a–d, ladder, unlabeled-α treated under otherwise identical conditions, F-α, T-α. B) Absorbance spectra overlay of F-(—) and T-(---) α. See also Table S1 and Figure S1. Note: peak splitting is a common spectral feature of TMR-labeled proteins (see for example, manuals from life technologies, genaxxon, and anaspec.com). C) Labeled protein hexamerizes efficiently. Gel filtration analysis of F-α with and without dATP. and ... designate A280 and A495 traces, respectively. See also Figure S2.
Figure 3
Figure 3
Fluorescence quenching is coupled to wt-α hexamerization. A) Emission spectra of 1:5 F-:T-α (0.2 μM) with increasing dATP concentration (0–200 μM). B) Dose-dependent fluorescence quenching promoted by α hexamerization inducers: dATP (●), ClFDP (◆), and ClFTP (▲). Standard deviation was derived from N=3. Normalized intensity of 1.0 is set for the largest magnitude of drop in fluorescence intensity at the saturating concentrations of respective inducers and corresponds to a 46–48% drop in F intensity at 520 nm. See also Figure S4 and S5.
Figure 4
Figure 4
Stopped-flow fluorescence measurements of 100 μM dATP-induced α dimerization and hexamerization. Each trace is an average of ≥9 independent traces. A) D57N-α dimerization rate as a function of mutant protein concentration. Averaged kinetic traces from representative concentrations are shown. Solid lines indicate fit to Eq 1. (See also Figure S7 and S8). The observed kapp is linearly dependent on the mutant protein concentration. kapp = 2[α]0k in Eq 1. C) A plot of d[I(t)]/dt2 against [I(t)]2 overlaying the data from D57N- (gray) and wt- (dark) α. D) Kinetic trace for dATP-promoted wt-α hexamerization measured over 300 s (gray curve). The black dashed curve and baseline traces indicate fit to the data using Berkeley Madonna (Eq 2) and residuals, respectively. See also Figure 5.
Figure 5
Figure 5
Kinetics of 100 μM dATP-induced wt-α hexamerization. A) Kinetic simulation for the overall hexamerization process. B) Initial period of simulation in (A). Simulations were carried out with Madonna software (v 8.3.18): the rate constants were derived from fitting the averaged kinetic trace in Figure 4C to Eq 2.1–2.4. See also the Text and SI (page 9). Note that (α*)2 did not accumulate but was rapidly converted to α6 at a rate faster than that of rate-determining (α*)2 formation. The experimental kinetic trace (Figure 4D) and Eq 2.1–2.4 thus exclude information on the fast steps beyond the rate-determining step. C) Representative averaged kinetic traces at various wt-α concentrations. See also Table S2 and Figure S9. Inset on the right is the expansion of the initial period at [α] = 0.2 μM (dark trace) overlayed with the corresponding trace for D57N-α (0.2 μM) (gray trace) after normalization.
Figure 6
Figure 6
(A–C) Estimating the rates of α2 → α6 and α2 → α transitions in saturating dATP. A) Averaged kinetic trace (N = 9) resulting from mixing dATP and wt-α presaturated with dGTP at the S site. See also Figure S10A. B) The first 50 s of a representative kinetic trace from (A). Solid black line indicates the fit to Eq 1. The baseline trace indicates residuals. See also Figure S10B. C) Fluorescence recovery after 1:1 v/v mixing of 2 μM unlabelled D57N-α dimers (in 200 μM dATP) and 375 nM labeled D57N-α dimers (1:1 F:T-D57N-α in 200 μM dATP). The solid line shows monoexponential fit. Residuals are shown at the baseline. D) Oligomerization model in the presence of saturating dATP. The reverse process is considered negligible in the presence of saturating dATP and was 1.1 × 10⁻³ s−1 for α2 → α. Dimerization is the rate-determining step (R.D.S) and is estimated to be one order of magnitude slower than subsequent oligomerization steps. α* is the proposed conformationally altered transient state of α that can ultimately undergo α hexamerization process as described in the text. Tetrameric state is proposed as a transient intermediate because α2 trimerization directly to α6 in a single step is considered to be an unlikely event. Ribbon depictions for α2 and α6 are based on the known crystal structures of hRNR-α (2WGH) and yeast RNR-α (3PAW), respectively. Each α monomer is shown in dark and light gray, and the N-terminal domain housing the A site is in black. See Table of Contents figure for depiction in color.

References

    1. Freeman M. Nature. 2000;408:313. - PubMed
    1. Sneppen K, Krishna S, Semsey S. Annu Rev Biophys. 2010;39:43. - PubMed
    1. Csete M, Doyle J. Trends Biotech. 2004;22:446. - PubMed
    1. Stubbe J, van der Donk W. Chem Rev. 2008;98:705. - PubMed
    1. Thelander L. Nat Gen. 2007;39:703. - PubMed

Publication types

MeSH terms

Substances

LinkOut - more resources