. 2014 Dec;13(6):1049-58.
doi: 10.1111/acel.12267. Epub 2014 Sep 26.

Shc depletion stimulates brown fat activity in vivo and in vitro

Affiliations

Shc depletion stimulates brown fat activity in vivo and in vitro

Alexey Tomilov et al. Aging Cell. 2014 Dec.

Abstract

Adipose tissue is an important metabolic organ that integrates a wide array of homeostatic processes and is crucial for whole-body insulin sensitivity and energy metabolism. Brown adipose tissue (BAT) is a key thermogenic tissue with a well-established role in energy expenditure. BAT dissipates energy and protects against both hypothermia and obesity. Thus, BAT stimulation therapy is a rational strategy for the looming pandemic of obesity, whose consequences and comorbidities have a huge impact on the aged. Shc-deficient mice (ShcKO) were previously shown to be lean, insulin sensitive, and resistant to high-fat diet and obesity. We investigated the contribution of BAT to this phenotype. Insulin-dependent BAT glucose uptake was higher in ShcKO mice. Primary ShcKO BAT cells exhibited increased mitochondrial respiration; increased expression of several mitochondrial and lipid-oxidative enzymes was observed in ShcKO BAT. Levels of brown fat-specific markers of differentiation, UCP1, PRDM16, ELOVL3, and Cox8b, were higher in ShcKO BAT. In vitro, Shc knockdown in BAT cell line increased insulin sensitivity and metabolic activity. In vivo, pharmacological stimulation of ShcKO BAT resulted in higher energy expenditure. Conversely, pharmacological inhibition of BAT abolished the improved metabolic parameters, that is the increased insulin sensitivity and glucose tolerance of ShcKO mice. Similarly, in vitro Shc knockdown in BAT cell lines increased their expression of UCP1 and metabolic activity. These data suggest increased BAT activity significantly contributes to the improved metabolic phenotype of ShcKO mice.

Keywords: Shc; brown adipose; brown adipose tissue; energy expenditure; healthy aging; insulin.


Figures

Figure 1
Figure 1
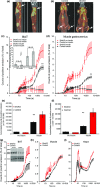
(a, b) Sagittal and axial PET/CT images of pseudofed mice through brown adipose tissue (BAT) and gastrocnemius muscle, shown by arrows. (c, d) PET intensities were normalized to total positron emissions for each mouse and plotted against time, traces for BAT and muscle are presented. (e, f) bars are means and SE of area under the curve (AUC) for BAT and muscle, P-values were generated with ANOVA, n = 4. (g, h, i) Fasted mice were stimulated with insulin. Traces of the [18F]FDG uptake by BAT, muscles and heart are shown. Reduction of Shc expression in ShcKO BAT is shown on Western blot, *P < 0.1, **P < 0.05.
Figure 2
Figure 2
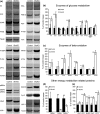
(a, b) Standard bioenergetic profiling traces and bars of O2 consumption rate (OCR) of ShcKO and control mice brown adipose tissue (BAT) cells cultivated in 25 mm glucose and 20% FBS, regiments are indicated, P-values were generated by AUC ANOVA n = 8. (c) traces of GLUCOX assay, BAT cells were ‘fasted’ in 2.5 mm glucose for 16 h. Rates 1–4 are basal proton production rate (PPR). Media was supplemented with 25 mm glucose as indicated, and PPR was recorded for additional 8 cycles. (d) Bars are means and SD of PPR, n = 8, and P-values were generated by AUC ANOVA. Two–three mice were used per day in three independent experiments, results were grouped by genotype; technical replication was 5, *P < 0.1, **P < 0.05.
Figure 3
Figure 3
(a) Representative Western blots are presented. Mice were kept in a conventional animal facility, fasted for 6 h and anesthetized with Nembutal 100 mg kg−1, the brown adipose tissue (BAT) tissue was extracted and Western-analyzed with indicated antibody. Signals were corrected by tubulin and presented as % of control, bars are means and SD. (b), expression of enzymes related to glycolysis, n = 5; (c) beta-oxidation, n = 5, (d) Shc isoforms, n = 20; (e) other energy metabolism related; P-values of ShcKO versus control were determined by two-tailed t-test, *P < 0.1, **P < 0.05.
Figure 4
Figure 4
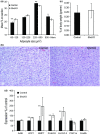
(a) Bars are % of adipocytes falling in indicated size distribution, P-values were calculated by nested random effect model, n = 5, technical replication also 5. (b) Representative image of control and ShcKO brown adipose tissue (BAT) sections at 250×. (c) Bars are means and SD of ShcKO and control interscapular BAT weights expressed as % of body weight, n = 6. (d) Mice were housed at 21 °C, interscapular BAT was extracted and expression of differentiated BAT markers was measured with Q-RT–PCR. Bars are means and SD, values are expressed as % of control, n = 4, technical replication 3, and P-values generated by One Way ANOVA followed by Scheffe's post hoc analysis, *P < 0.1, **P < 0.05.
Figure 5
Figure 5
(a) GTT, (b) ITT of ShcKO and controls; (c) GTT, (d) ITT, mice were pre-injected with SR5930, n = 15. (e) Bars are means and SE of basal and epinephrine-induced energy expenditure (EE) of ShcKO and control mice housed at 21 °C, n = 9. (f) Traces are representative epinephrine-induced EE curves of control and ShcKO mice as indicated. P-values were generated by one way ANOVA followed by Scheffe's post hoc planned comparison, *P < 0.1, **P < 0.05 for ShcKO versus control or indicated as face values.
Figure 6
Figure 6
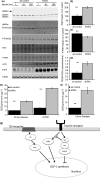
(a) differentiated shShc and shControl brown fat cell line (BATCL) stimulated with insulin and Westerns analyzed with indicated antibody. (b, c, d) bars are densitometry means and standard deviations of PDH expression normalized to tubulin, total PDH, phospho PDH (P-PDH), and ratio PDH/P-PDH, respectively, P-values were from two-tailed t-test, n = 6. (e, f) OCRs of shControl and shShc BATCL utilizing 25 mm glucose or 0.8 mm palmitate, as indicated, and P-values are determined with AUC ANOVA, n = 10. (g) Model of regulatory elements for UCP1 expression adopted and modified from (Klein et al., 2000). UCP1 expression is regulated both by G protein-coupled β3-adrenergic receptors and signals from the insulin receptor. Shc transfers insulin signal to ERK-the inhibitory arm of UCP1 expression. Shc opposes Pi3Kα arm of UCP1 regulation the stimulatory arm. Thus, Shc reduction makes the inhibitory arm weaker and stimulatory arm stronger, and promotes UCP1 expression*P < 0.1, **P < 0.05.

Similar articles

Cited by

References

    1. Ahfeldt T, Schinzel RT, Lee YK, Hendrickson D, Kaplan A, Lum DH, Camahort R, Xia F, Shay J, Rhee EP, Clish CB, Deo RC, Shen T, Lau FH, Cowley A, Mowrer G, Al-Siddiqi H, Nahrendorf M, Musunuru K, Gerszten RE, Rinn JL, Cowan CA. Programming human pluripotent stem cells into white and brown adipocytes. Nat. Cell Biol. 2012;14:209–219. - PMC - PubMed
    1. Berniakovich I, Trinei M, Stendardo M, Migliaccio E, Minucci S, Bernardi P, Pelicci PG, Giorgio M. p66Shc-generated oxidative signal promotes fat accumulation. J. Biol. Chem. 2008;283:34283–34293. M804362200. - PMC - PubMed
    1. Boney CM, Sekimoto H, Gruppuso PA, Frackelton AR., Jr Src family tyrosine kinases participate in insulin-like growth factor I mitogenic signaling in 3T3-L1 cells. Cell Growth Differ. 2001;12:379–386. - PubMed
    1. Camici GG, Schiavoni M, Francia P, Bachschmid M, Martin-Padura I, Hersberger M, Tanner FC, Pelicci P, Volpe M, Anversa P, Luscher TF, Cosentino F. Genetic deletion of p66(Shc) adaptor protein prevents hyperglycemia-induced endothelial dysfunction and oxidative stress. Proc. Natl Acad. Sci. USA. 2007;104:5217–5222. - PMC - PubMed
    1. Cannon B, Nedergaard J. Yes, even human brown fat is on fire! J. Clin. Invest. 2012;122:486–489. - PMC - PubMed

Publication types

Substances