Implementing statistical equating for MRCP(UK) Parts 1 and 2
- PMID: 25257070
- PMCID: PMC4182791
- DOI: 10.1186/1472-6920-14-204
Implementing statistical equating for MRCP(UK) Parts 1 and 2
Abstract
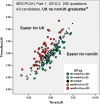
Background: The MRCP(UK) exam, in 2008 and 2010, changed the standard-setting of its Part 1 and Part 2 examinations from a hybrid Angoff/Hofstee method to statistical equating using Item Response Theory, the reference group being UK graduates. The present paper considers the implementation of the change, the question of whether the pass rate increased amongst non-UK candidates, any possible role of Differential Item Functioning (DIF), and changes in examination predictive validity after the change.
Methods: Analysis of data of MRCP(UK) Part 1 exam from 2003 to 2013 and Part 2 exam from 2005 to 2013.
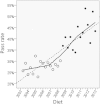
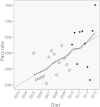
Results: Inspection suggested that Part 1 pass rates were stable after the introduction of statistical equating, but showed greater annual variation probably due to stronger candidates taking the examination earlier. Pass rates seemed to have increased in non-UK graduates after equating was introduced, but was not associated with any changes in DIF after statistical equating. Statistical modelling of the pass rates for non-UK graduates found that pass rates, in both Part 1 and Part 2, were increasing year on year, with the changes probably beginning before the introduction of equating. The predictive validity of Part 1 for Part 2 was higher with statistical equating than with the previous hybrid Angoff/Hofstee method, confirming the utility of IRT-based statistical equating.
Conclusions: Statistical equating was successfully introduced into the MRCP(UK) Part 1 and Part 2 written examinations, resulting in higher predictive validity than the previous Angoff/Hofstee standard setting. Concerns about an artefactual increase in pass rates for non-UK candidates after equating were shown not to be well-founded. Most likely the changes resulted from a genuine increase in candidate ability, albeit for reasons which remain unclear, coupled with a cognitive illusion giving the impression of a step-change immediately after equating began. Statistical equating provides a robust standard-setting method, with a better theoretical foundation than judgemental techniques such as Angoff, and is more straightforward and requires far less examiner time to provide a more valid result. The present study provides a detailed case study of introducing statistical equating, and issues which may need to be considered with its introduction.
Figures


References
-
- Postgraduate Medical Education and Training Board . Standards for Curricula and Assessment Systems. London: PMETB; 2008.
-
- Cizek GJ, Bunch MB. Standard Setting: A Guide to Establishing and Evaluating Performance Standards on Tests. Thousand Oaks, California: Sage; 2007.
-
- American Educational Research Association, American Psychological Association, National Council on Measurement in Education . Standards for Educational and Psychological Testing. Washington, DC: American Educational Research Association; 1999.
-
- Case SM, Swanson DB. Constructing Written Test Questions for the Basic and Clinical Sciences. Philadelphia: National Board of Medical Examiners; 1996.
-
- Streiner DL, Norman GR. Health Measurement Scales: A Practical Guide to Their Development and use. 4. Oxford: Oxford University Press; 2008.
Pre-publication history
-
- The pre-publication history for this paper can be accessed here:http://www.biomedcentral.com/1472-6920/14/204/prepub
MeSH terms
LinkOut - more resources
Full Text Sources
Other Literature Sources

