. 2014 Sep 26;345(6204):1251086.
doi: 10.1126/science.1251086.

Epigenetic programming of monocyte-to-macrophage differentiation and trained innate immunity

Affiliations

Epigenetic programming of monocyte-to-macrophage differentiation and trained innate immunity

Sadia Saeed et al. Science. .

Abstract

Monocyte differentiation into macrophages represents a cornerstone process for host defense. Concomitantly, immunological imprinting of either tolerance or trained immunity determines the functional fate of macrophages and susceptibility to secondary infections. We characterized the transcriptomes and epigenomes in four primary cell types: monocytes and in vitro-differentiated naïve, tolerized, and trained macrophages. Inflammatory and metabolic pathways were modulated in macrophages, including decreased inflammasome activation, and we identified pathways functionally implicated in trained immunity. β-glucan training elicits an exclusive epigenetic signature, revealing a complex network of enhancers and promoters. Analysis of transcription factor motifs in deoxyribonuclease I hypersensitive sites at cell-type-specific epigenetic loci unveiled differentiation and treatment-specific repertoires. Altogether, we provide a resource to understand the epigenetic changes that underlie innate immunity in humans.


Figures

Fig. 1
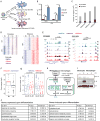
Fig. 1. Epigenomic and transcriptional changes during monocyte to macrophage differentiation
(A) Upon migration into tissues under homeostatic conditions, monocytes (Mo) differentiate into macrophages (Mf). In addition, monocytes will enter into either a refractory state described as endotoxin ‘tolerance’ that is mimicked in vitro with a short LPS stimulation (LPS-Mf) or a state of increased responsiveness described as ‘trained immunity’ that is mimicked in vitro with a short β-glucan incubation (BG-Mf) (See also Fig. S4E). (B) Cytokine production determined by ELISA in supernatants of monocytes primed for 24 h with: cell culture medium (Mf), β-glucan (BG-Mf) or LPS (LPS-Mf), and re-stimulated on day 6 for an additional 24 hours. * p<0.05 and ** p<0.005 (Wilcoxon signed rank test). Data are presented as mean ± SEM (pooled data from n ≥10 individuals in 4 independent experiments). (C) The proportion of dynamic transcripts and epigenetic regions that differ by at least two median absolute deviations for the H3K27ac, H3K4me3 and H3K4me1 epigenetic marks as a function of monocyte differentiation and/or priming regimens. (D) Pileup heat map of the epigenetic marks from ‘C’ at promoters and enhancers in monocytes (Mo) and macrophages (Mf). Rows are genomic regions from −12 to +12 kb around the center of the peaks; the signal intensity was determined in windows of 400 bp. (E) Screen shots of the epigenetic landscape at the CELSR1 (right) or CD300E (left) loci, two representative examples of loci that display important changes during macrophage differentiation. (F) Boxplot presentation of changes in transcript levels during differentiation (Mo to Mf) for the closest differentially expressed genes (within 100 kb) from the dynamic H3K27ac marked regions. (G) Boxplot presentation of changes in the H3K27ac and H3K4me1 signal at distal H3K27ac binding sites, in the vicinity (closest within 100 kb) of up-(left) and down-regulated (right) genes during Mo to Mf differentiation. (H) Modulation of the inflammasome and NF-κB pathways during monocyte to macrophages differentiation. (I) Monocytes (Mo) and macrophages (Mf) were left unstimulated (−) or stimulated with LPS (10 ng/mL) for 24 hours (+). Inflammasome activation was determined by western blot for IL-1β and pro-interleukin-1 β (proIL-1β). The results are representative of at least three independent experiments. (J) GO analysis. Enriched GO categories in a set of significantly (4-fold change, RPKM > 2) down- and up-regulated genes when comparing monocytes (Mo) to macrophages (Mf).
Fig. 2
Fig. 2. Epigenetic analysis of dynamic regions in monocytes (Mo) and three macrophage states (Mf, LPS-Mf and BG-Mf)
(A, B) Heat map showing dynamic acetylation marks in enhancers (A) and promoters (B). Dynamic H3K4me regions devoid of H3K27ac are displayed in fig. S2. (C) Heat map of pair-wise overlaps of genes associated with dynamic promoter (ACp) and distal regulatory element (ACe) cluster. P-values (−log10) were obtained by the hypergeometric test, reflecting the probability that the obtained number of shared target genes would be shared by any two equivalent random gene sets. (D) Two representative gene loci corresponding to ITGA3 and IRAK3 that gain H3 lysine modifications in BG-Mf and LPS-Mf, respectively. (E) Epigenetic clusters as assigned by ChromHMM analysis (37) for primary human monocytes. For each cluster, the percentage of elements with the designations heterochromatic (H3K9me3, H3K27me3 or empty), active promoter (H3K4me3), inactive promoter (H3K4me3 and H3K27me3), active regulatory element (H3K4me1 and H3K27ac), inactive regulatory element (H3K4me1) and transcribed segment (H3K36me3), was calculated.
Fig. 3
Fig. 3. Gene Ontology analysis of epigenetic and transcript clusters in monocytes (Mo) and the three macrophage states (Mf, LPS-Mf and BG-Mf)
(A) Gene expression patterns were analyzed using a polytomous analysis of gene expression profiles that contrasts LPS-Mf and BG-Mf relative to Mf, as explained in detail in the text. Genes plotted are those with a fold change > 4 and a polytomous post-hoc probability > 0.35. (B) Enriched GO categories in the major expression modules represented in Fig. 3A. (C) Heat map presentation of the percentage of genes in a module that overlap with a dynamic ACp or ACe cluster.
Fig. 4
Fig. 4. The transcription factor repertoires of monocytes and derived macrophages
(A) Bar representation of the transcription factor family members that are expressed in at least one of the four cell samples (Mo, Mf, LPS-Mf, BG-Mf). The number of TFs with RPKM values > 2 is plotted and the total number of TF family members in humans is indicated between brackets. (BC) Heat map of the expression levels (log2 RPKM) of TFs that change expression at least fourfold in at least one of the four conditions examined. TFs are grouped according to families and whether they are up- or down-regulated upon differentiation. Scale (left) indicates the level of expression (log2 RPKM). (D) Hierarchical clustering of the TF motif occurrence frequency (log2 percentage, scale at top) in each ACe cluster-associated DHSs from all TFs motifs that have more than 5% occurrence in at least one instance and that are over-represented in at least one of the ACe clusters compared to all non-dynamic acetylated regions (hypergeometric test, p-value <0.01).
Fig. 5
Fig. 5. cAMP pathway analysis and in vitro and in vivo validation
(A) cAMP signaling pathway remodeling. Significant (two-tailed t-test, p<0.05) transcript level decreases (blue) and increases (red) in all macrophage states relative to monocytes (Mo), as well as β-glucan treatment-specific increases are indicated, see also Fig. S8. (B) Diagram of the timeline and experimental setup of the in vitro cAMP inhibition experiment. cAMP inhibitors or vehicle were applied to human primary monocytes during the first 24 hours of “training” (see Fig. S4E and (70) for details). After 6 days, secondary stimulation of cells was performed with LPS to induce cytokine production. (CE) The inhibitor of adenylate cyclase 2′,5′-Dideoxyadenosine (ddA), the cAMP dependent protein kinase (PKA) inhibitor H89 and the β-adrenergic receptor blocker propranolol inhibited the induction of training by β-glucan, assayed as the response to LPS stimulus on day six. * p<0.05 (Wilcoxon signed rank test). Data show the fold increase in cytokine production upon training as compared to untrained Mf-cells and are presented as mean ± SEM, n > 6 in 3 separate ELISA experiments. (F) Timeline of the in vivo training experiment in mice. Mice were either injected intravenously with PBS (control) or a non-lethal dose of C. albicans (2×10⁴ CFU/mouse) seven days prior to intravenous inoculation of a lethal C. albicans dose (2×10⁶ CFU/mouse). In a third group of mice, propranolol was administered before the inoculation of the non-lethal dose of C. albicans (70). (G) Survival rate of wild-type C57BL/6 mice to a systemic infection with C. albicans (n 8 per group).

Comment in

  • Macrophages: innate memory training.
    Bordon Y. Bordon Y. Nat Rev Immunol. 2014 Nov;14(11):713. doi: 10.1038/nri3759. Epub 2014 Oct 10. Nat Rev Immunol. 2014. PMID: 25301255 No abstract available.

References

    1. Lewis JS, Lee JA, Underwood JC, Harris AL, Lewis CE. Macrophage responses to hypoxia: relevance to disease mechanisms. J Leukoc Biol. 1999;66:889–900. - PubMed
    1. Geissmann F, et al. Development of monocytes, macrophages, and dendritic cells. Science. 2010;327:656–661. - PMC - PubMed
    1. Auffray C, Sieweke MH, Geissmann F. Blood monocytes: development, heterogeneity ,and relationship with dendritic cells. Annu Rev Immunol. 2009;27:669–692. - PubMed
    1. Davies LC, Jenkins SJ, Allen JE, Taylor PR. Tissue-resident macrophages. Nature immunology. 2013;14:986–995. - PMC - PubMed
    1. Ginhoux F, Jung S. Monocytes and macrophages: developmental pathways and tissue homeostasis. Nat Rev Immunol. 2014;14:392–404. - PubMed

Publication types

Associated data