

Neutralizing anti-interleukin-1β antibodies modulate fetal blood-brain barrier function after ischemia
- PMID: 25258170
- PMCID: PMC4252260
- DOI: 10.1016/j.nbd.2014.09.007
Neutralizing anti-interleukin-1β antibodies modulate fetal blood-brain barrier function after ischemia
Abstract
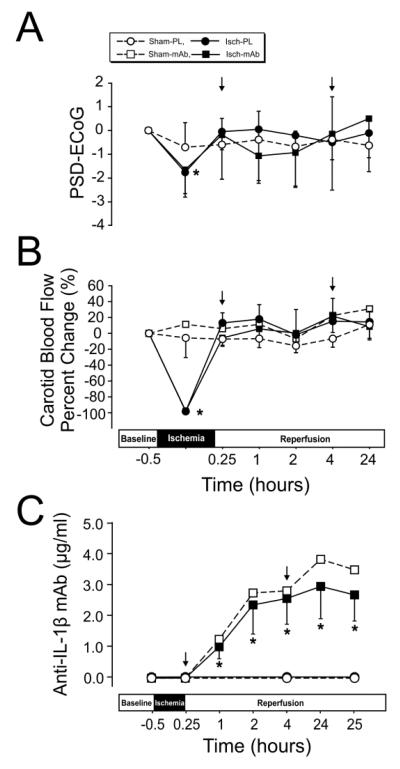
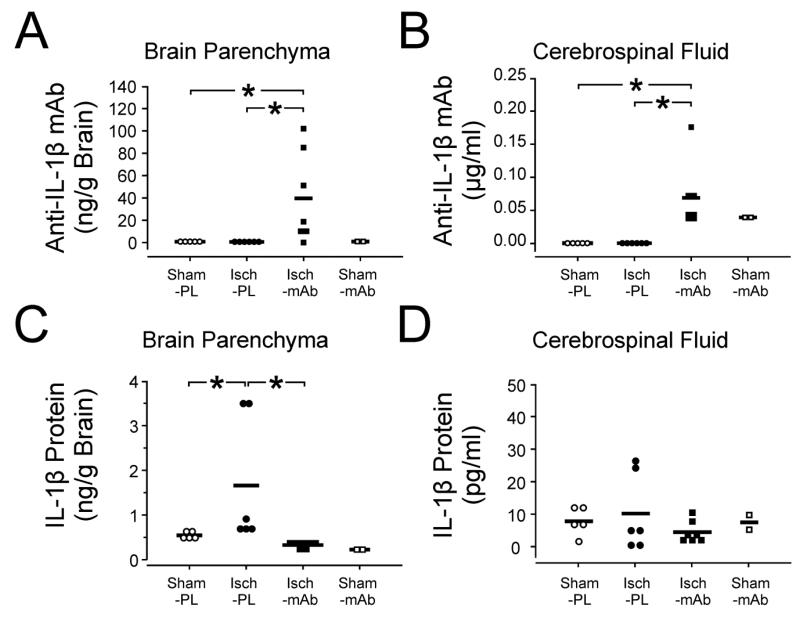
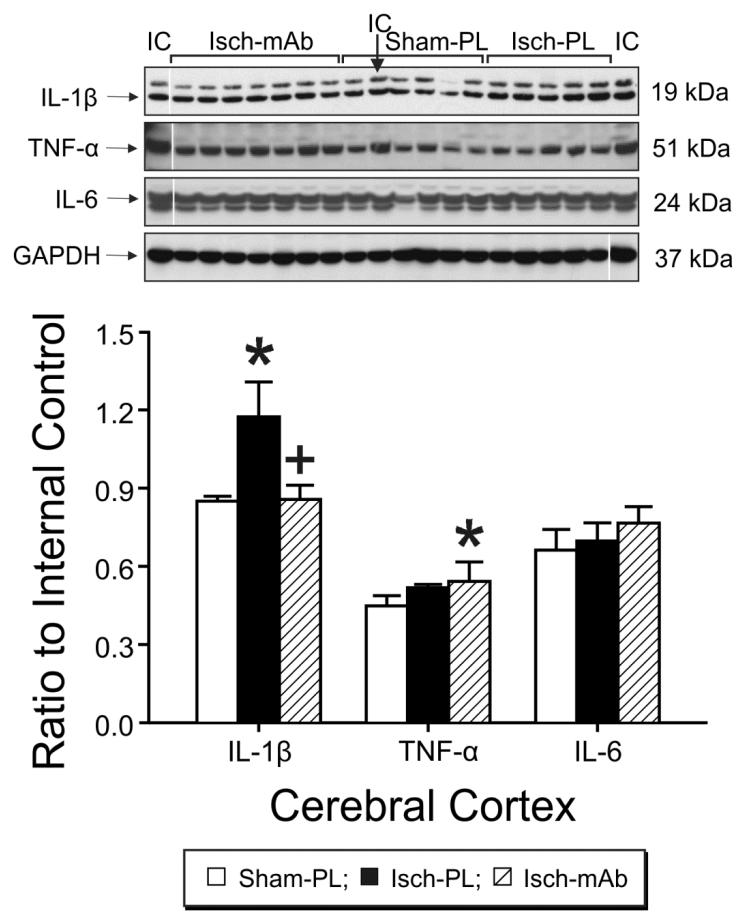
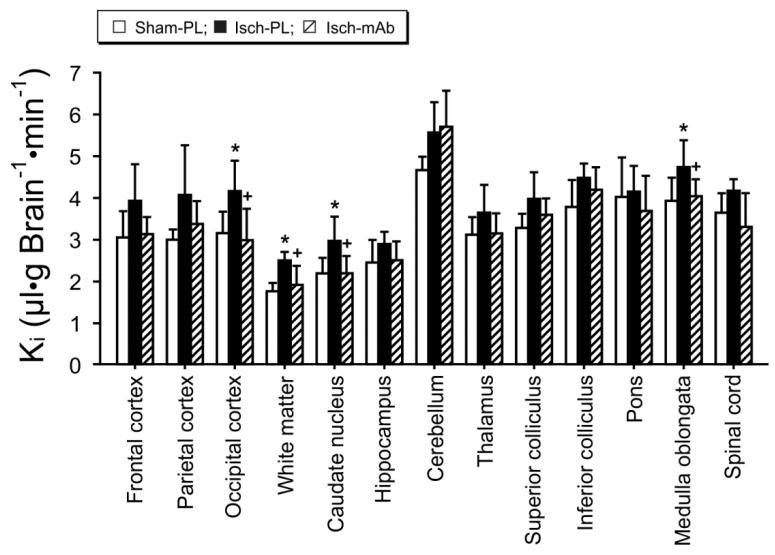
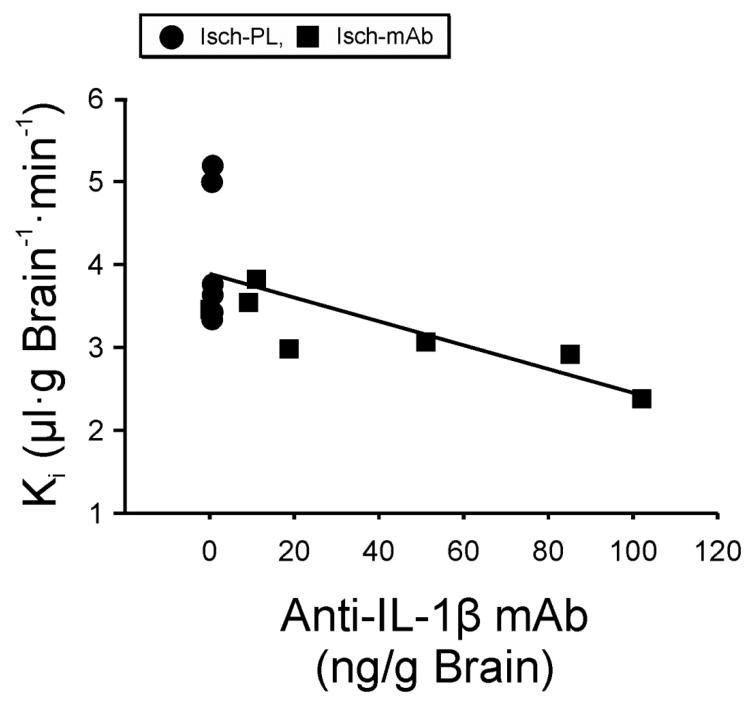
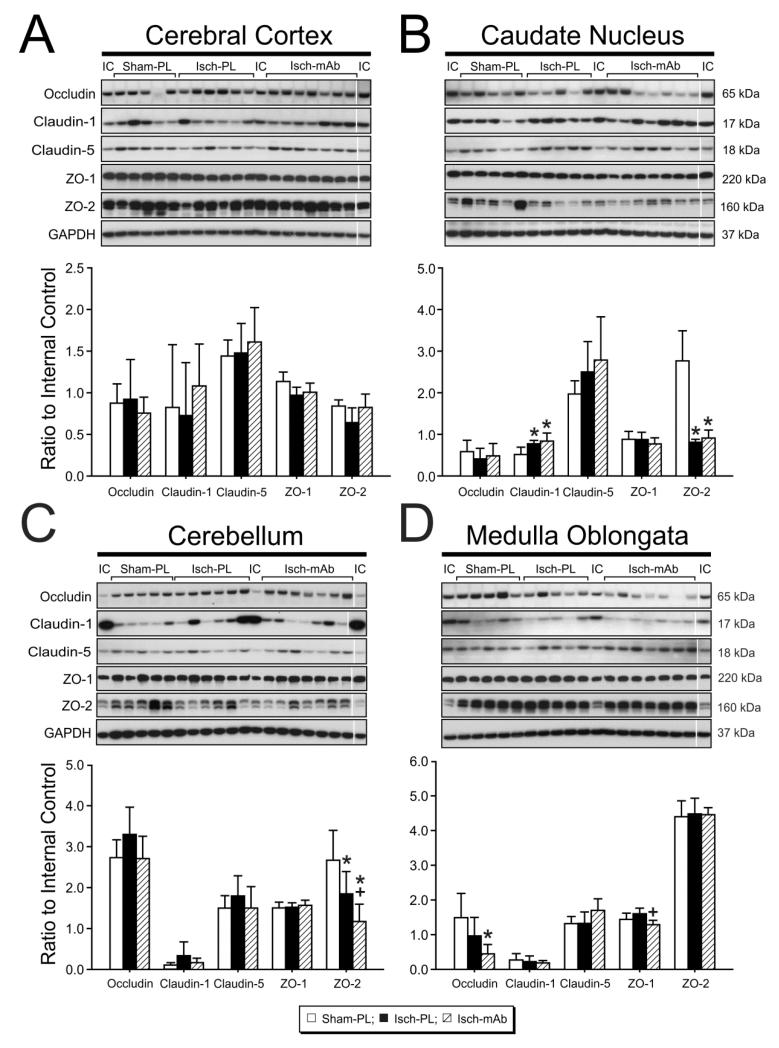
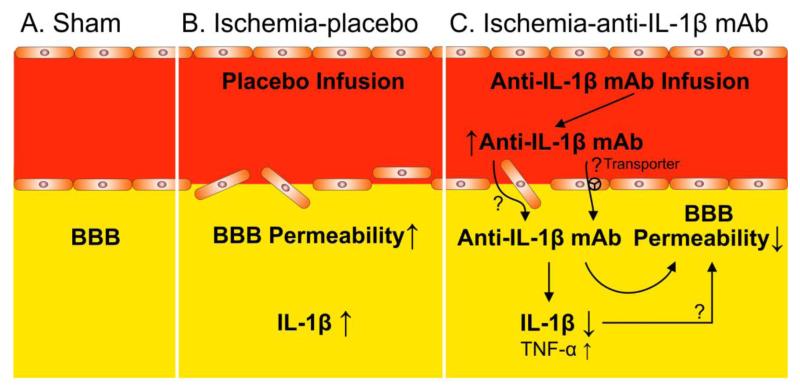
We have previously shown that increases in blood-brain barrier permeability represent an important component of ischemia-reperfusion related brain injury in the fetus. Pro-inflammatory cytokines could contribute to these abnormalities in blood-brain barrier function. We have generated pharmacological quantities of mouse anti-ovine interleukin-1β monoclonal antibody and shown that this antibody has very high sensitivity and specificity for interleukin-1β protein. This antibody also neutralizes the effects of interleukin-1β protein in vitro. In the current study, we hypothesized that the neutralizing anti-interleukin-1β monoclonal antibody attenuates ischemia-reperfusion related fetal blood-brain barrier dysfunction. Instrumented ovine fetuses at 127 days of gestation were studied after 30 min of carotid occlusion and 24h of reperfusion. Groups were sham operated placebo-control- (n=5), ischemia-placebo- (n=6), ischemia-anti-IL-1β antibody- (n=7), and sham-control antibody- (n=2) treated animals. Systemic infusions of placebo (0.154M NaCl) or anti-interleukin-1β monoclonal antibody (5.1±0.6 mg/kg) were given intravenously to the same sham or ischemic group of fetuses at 15 min and 4h after ischemia. Concentrations of interleukin-1β protein and anti-interleukin-1β monoclonal antibody were measured by ELISA in fetal plasma, cerebrospinal fluid, and parietal cerebral cortex. Blood-brain barrier permeability was quantified using the blood-to-brain transfer constant (Ki) with α-aminoisobutyric acid in multiple brain regions. Interleukin-1β protein was also measured in parietal cerebral cortices and tight junction proteins in multiple brain regions by Western immunoblot. Cerebral cortical interleukin-1β protein increased (P<0.001) after ischemia-reperfusion. After anti-interleukin-1β monoclonal antibody infusions, plasma anti-interleukin-1β monoclonal antibody was elevated (P<0.001), brain anti-interleukin-1β monoclonal antibody levels were higher (P<0.03), and interleukin-1β protein concentrations (P<0.03) and protein expressions (P<0.001) were lower in the monoclonal antibody-treated group than in placebo-treated-ischemia-reperfusion group. Monoclonal antibody infusions attenuated ischemia-reperfusion-related increases in Ki across the brain regions (P<0.04), and Ki showed an inverse linear correlation (r= -0.65, P<0.02) with anti-interleukin-1β monoclonal antibody concentrations in the parietal cortex, but had little effect on tight junction protein expression. We conclude that systemic anti-interleukin-1β monoclonal antibody infusions after ischemia result in brain anti-interleukin-1β antibody uptake, and attenuate ischemia-reperfusion-related interleukin-1β protein up-regulation and increases in blood-brain barrier permeability across brain regions in the fetus. The pro-inflammatory cytokine, interleukin-1β, contributes to impaired blood-brain barrier function after ischemia in the fetus.
Keywords: Blood–brain barrier; Brain; Cytokines; Interleukin-1β; Ischemia–reperfusion; Monoclonal antibody; Ovine fetus; Sheep.
Copyright © 2014 Elsevier Inc. All rights reserved.
Figures
Similar articles
-
Interleukin-1β transfer across the blood-brain barrier in the ovine fetus.J Cereb Blood Flow Metab. 2015 Sep;35(9):1388-95. doi: 10.1038/jcbfm.2015.134. Epub 2015 Jun 17. J Cereb Blood Flow Metab. 2015. PMID: 26082012 Free PMC article.
-
Neutralizing anti-interleukin-1β antibodies reduce ischemia-related interleukin-1β transport across the blood-brain barrier in fetal sheep.Neuroscience. 2017 Mar 27;346:113-125. doi: 10.1016/j.neuroscience.2016.12.051. Epub 2017 Jan 9. Neuroscience. 2017. PMID: 28089577 Free PMC article.
-
Anti-IL-6 neutralizing antibody modulates blood-brain barrier function in the ovine fetus.FASEB J. 2015 May;29(5):1739-53. doi: 10.1096/fj.14-258822. Epub 2015 Jan 21. FASEB J. 2015. PMID: 25609424 Free PMC article.
-
Systemic infusions of anti-interleukin-1β neutralizing antibodies reduce short-term brain injury after cerebral ischemia in the ovine fetus.Brain Behav Immun. 2018 Jan;67:24-35. doi: 10.1016/j.bbi.2017.08.002. Epub 2017 Aug 2. Brain Behav Immun. 2018. PMID: 28780000 Free PMC article.
-
Ischemia-reperfusion impairs blood-brain barrier function and alters tight junction protein expression in the ovine fetus.Neuroscience. 2012 Dec 13;226:89-100. doi: 10.1016/j.neuroscience.2012.08.043. Epub 2012 Sep 15. Neuroscience. 2012. PMID: 22986172 Free PMC article.
Cited by
-
Preterm Brain Injury, Antenatal Triggers, and Therapeutics: Timing Is Key.Cells. 2020 Aug 10;9(8):1871. doi: 10.3390/cells9081871. Cells. 2020. PMID: 32785181 Free PMC article. Review.
-
Interleukin-1β transfer across the blood-brain barrier in the ovine fetus.J Cereb Blood Flow Metab. 2015 Sep;35(9):1388-95. doi: 10.1038/jcbfm.2015.134. Epub 2015 Jun 17. J Cereb Blood Flow Metab. 2015. PMID: 26082012 Free PMC article.
-
IL-1β is a key cytokine that induces trypsin upregulation in the influenza virus-cytokine-trypsin cycle.Arch Virol. 2017 Jan;162(1):201-211. doi: 10.1007/s00705-016-3093-3. Epub 2016 Oct 6. Arch Virol. 2017. PMID: 27714503 Free PMC article.
-
Transcellular routes of blood-brain barrier disruption.Exp Biol Med (Maywood). 2022 May;247(9):788-796. doi: 10.1177/15353702221080745. Epub 2022 Mar 4. Exp Biol Med (Maywood). 2022. PMID: 35243912 Free PMC article.
-
Hypoxic-ischemic-related cerebrovascular changes and potential therapeutic strategies in the neonatal brain.J Neurosci Res. 2020 Jul;98(7):1468-1484. doi: 10.1002/jnr.24590. Epub 2020 Feb 14. J Neurosci Res. 2020. PMID: 32060970 Free PMC article. Review.
References
-
- Abbott NJ, et al. Structure and function of the blood-brain barrier. Neurobiol Dis. 2010;37:13–25. - PubMed
-
- Back SA, et al. Role Of Instrumented Fetal Sheep Preparations In Defining The Pathogenesis Of Human Periventricular White-matter Injury. J Child Neurol. 2006;21:582–9. - PubMed
-
- Banks WA. Are the extracellular [correction of extracelluar] pathways a conduit for the delivery of therapeutics to the brain? Curr Pharm Des. 2004;10:1365–70. - PubMed
-
- Banks WA, et al. Effects of a behaviorally active antibody on the brain uptake and clearance of amyloid beta proteins. Peptides. 2005;26:287–94. - PubMed
-
- Banks WA, et al. Passage of amyloid beta protein antibody across the blood-brain barrier in a mouse model of Alzheimer’s disease. Peptides. 2002;23:2223–6. - PubMed
Publication types
MeSH terms
Substances
Grants and funding
LinkOut - more resources
Full Text Sources
Other Literature Sources
