. 2015 Feb;36(2):309-16.
doi: 10.3174/ajnr.A4116. Epub 2014 Sep 25.

Ultra-high-field MR imaging in polymicrogyria and epilepsy

Affiliations

Ultra-high-field MR imaging in polymicrogyria and epilepsy

A De Ciantis et al. AJNR Am J Neuroradiol. 2015 Feb.

Abstract

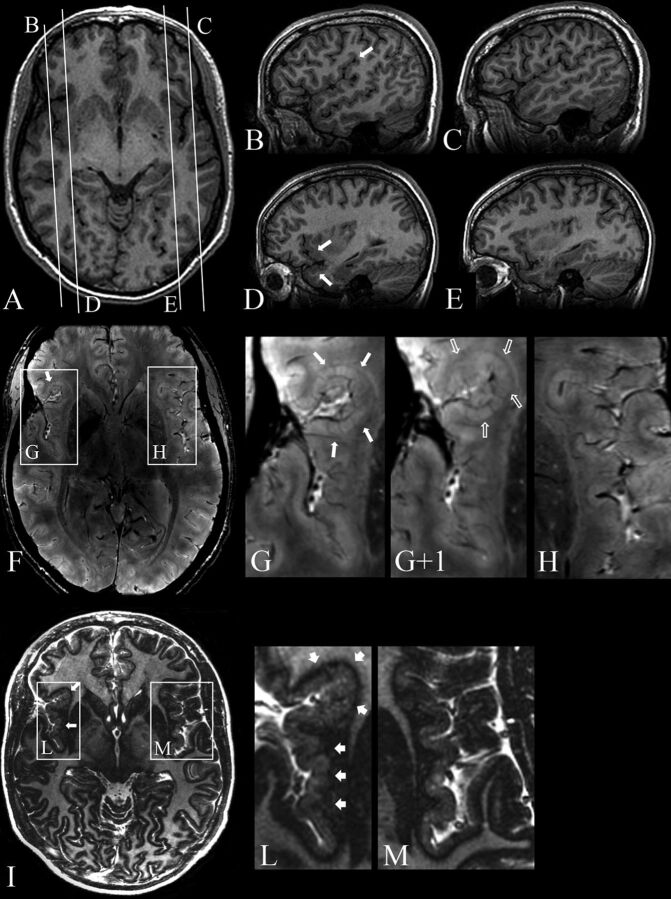
Background and purpose: Polymicrogyria is a malformation of cortical development that is often identified in children with epilepsy or delayed development. We investigated in vivo the potential of 7T imaging in characterizing polymicrogyria to determine whether additional features could be identified.

Materials and methods: Ten adult patients with polymicrogyria previously diagnosed by using 3T MR imaging underwent additional imaging at 7T. We assessed polymicrogyria according to topographic pattern, extent, symmetry, and morphology. Additional imaging sequences at 7T included 3D T2* susceptibility-weighted angiography and 2D tissue border enhancement FSE inversion recovery. Minimum intensity projections were used to assess the potential of the susceptibility-weighted angiography sequence for depiction of cerebral veins.

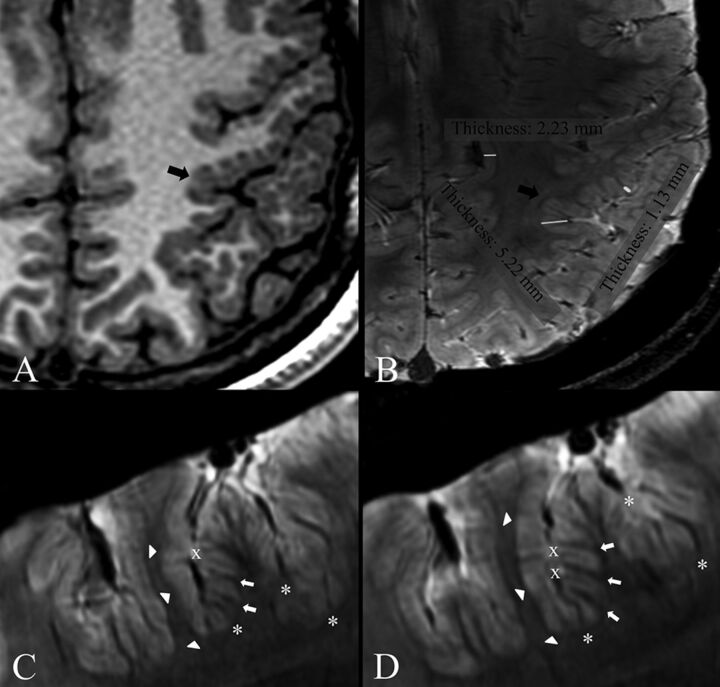
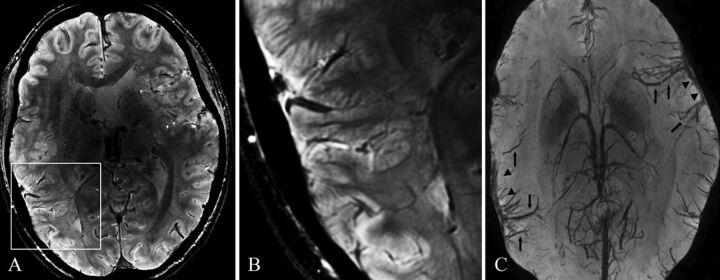
Results: At 7T, we observed perisylvian polymicrogyria that was bilateral in 6 patients, unilateral in 3, and diffuse in 1. Four of the 6 bilateral abnormalities had been considered unilateral at 3T. While 3T imaging revealed 2 morphologic categories (coarse, delicate), 7T susceptibility-weighted angiography images disclosed a uniform ribbonlike pattern. Susceptibility-weighted angiography revealed numerous dilated superficial veins in all polymicrogyric areas. Tissue border enhancement imaging depicted a hypointense line corresponding to the gray-white interface, providing a high definition of the borders and, thereby, improving detection of the polymicrogyric cortex.

Conclusions: 7T imaging reveals more anatomic details of polymicrogyria compared with 3T conventional sequences, with potential implications for diagnosis, genetic studies, and surgical treatment of associated epilepsy. Abnormalities of cortical veins may suggest a role for vascular dysgenesis in pathogenesis.


Figures

Fig 1.
Fig 1.
Patient 8. 3T axial (A) and sagittal (B–E) 3D FSPGR, 7T 3D SWAN (F), and magnified images (G, G+1, H), 7T axial 2D TBE FSE-IR (I) and magnified images (L and M). A, Mild cortical thickening in the right frontal operculum. Contiguous sagittal sections across the frontal operculum and the Sylvian fissure on the right (B and D) and left (C and E) sides provide a better comparative view of the morphologic characteristics of malformed-versus-normal cortex. B, An abnormal right Sylvian fissure (arrow), which is vertically oriented, shortened, and bordered by thick and irregular cortex. D, Thickening of the cortex in the inferior frontal gyrus and superior temporal gyrus (arrows). F, Two contiguous expanded views, from caudal (G) to rostral (G+1), provide ultra-high-resolution details of the right frontal operculum, which are not visible at 3T (A–E), substantiating the presence of a polymicrogyric cortex. H, A magnification of the homologous contralateral region clearly enhances the appreciation of the difference in folding of the polymicrogyric and normal cortex. I, Magnifications (L and M) show a hypointense line representing the gray-white matter interface and provide a high definition of the polymicrogyric (L, arrows) and normal (M) cortex, making it easier to appreciate irregularities in thickness and folding of the polymicrogyric cortex.
Fig 2.
Fig 2.
Patients 1 (A and B) and 9 (C and D). Comparison of 3T axial 3D FSPGR (A) and 7T axial 3D SWAN (B) images. Contiguous 7T axial 3D SWAN acquisitions show anatomic details of the polymicrogyric cortex (C and D). A, Delicate appearance of the polymicrogyric cortex in the left pre- and postcentral sulci, characterized by multiple small and delicate gyri of thin cortex (arrow). B, A thin and undulated polymicrogyric cortex, in which the spaces between microgyri are filled by thin white matter digitations, which have a low periodicity and are loosely packed. The gray-white matter junction is bordered by a thin hypointense line. 7T can, therefore, resolve the individual microgyri, revealing how grossly different morphologic characters (coarse or delicate) at 3T result, in fact, from variations of a common underlying morphologic pattern. B, Examples of cortical thickness measurements of normal (2.23 mm) and polymicrogyric cortex (1.13–5.22 mm) by using the straight-line distance measure between the surface and depth of the cortex. C and D, SWAN images show details of cortical structures and allow disentanglement of the structural units underlying the radiologic appearance of polymicrogyria. The typical undulated aspect is clearly detectable following the hypointense lines of the cortical border (arrowheads), which we assume represent arcuate white matter fibers, the white matter digitations within the gyri (arrows), the small vessels joining the pial veins (asterisks), and the fused molecular layer (crosses).
Fig 3.
Fig 3.
Patient 9. 7T axial 3D SWAN (A, magnified in B) and its minimum intensity projection reconstruction (C). A, Bilateral polymicrogyria involving the left frontal operculum and Sylvian fissure and the right Sylvian fissure and temporal lobe. B, Details of the polymicrogyric cortex in the right temporal lobe (magnified). C, Minimum intensity projection reconstruction shows dilated superficial veins in correspondence with the polymicrogyric areas (arrowheads); the large vascular structures running through the polymicrogyric sulci (arrows) define the location and the extent of the malformation.

Similar articles

Cited by

References

    1. Barkovich AJ, Guerrini R, Kuzniecky RI, et al. . A developmental and genetic classification for malformations of cortical development: update 2012. Brain 2012;135:1348–69 - PMC - PubMed
    1. Barkovich AJ. MRI analysis of sulcation morphology in polymicrogyria. Epilepsia 2010;51:17–22 - PMC - PubMed
    1. Barkovich AJ, Kuzniecky RI, Jackson GD, et al. . A developmental and genetic classification for malformations of cortical development. Neurology 2005;65:1873–87 - PubMed
    1. Harding B, Copp AJ. Malformations. In: Graham DI, Lantos PL, eds. Greenfield's Neuropathology. 6th ed. London: Arnold; 1997:397–533
    1. Barkovich AJ, Lindan CE. Congenital cytomegalovirus infection of the brain: imaging analysis and embryologic considerations. AJNR Am J Neuroradiol 1994;15:703–15 - PMC - PubMed

Publication types