

Combining MRI with NIHSS thresholds to predict outcome in acute ischemic stroke: value for patient selection
- PMID: 25258369
- PMCID: PMC4462135
- DOI: 10.3174/ajnr.A4103
Combining MRI with NIHSS thresholds to predict outcome in acute ischemic stroke: value for patient selection
Abstract
Background and purpose: Selecting acute ischemic stroke patients for reperfusion therapy on the basis of a diffusion-perfusion mismatch has not been uniformly proved to predict a beneficial treatment response. In a prior study, we have shown that combining clinical with MR imaging thresholds can predict clinical outcome with high positive predictive value. In this study, we sought to validate this predictive model in a larger patient cohort and evaluate the effects of reperfusion therapy and stroke side.
Materials and methods: One hundred twenty-three consecutive patients with anterior circulation acute ischemic stroke underwent MR imaging within 6 hours of stroke onset. DWI and PWI volumes were measured. Lesion volume and NIHSS score thresholds were used in models predicting good 3-month clinical outcome (mRS 0-2). Patients were stratified by treatment and stroke side.
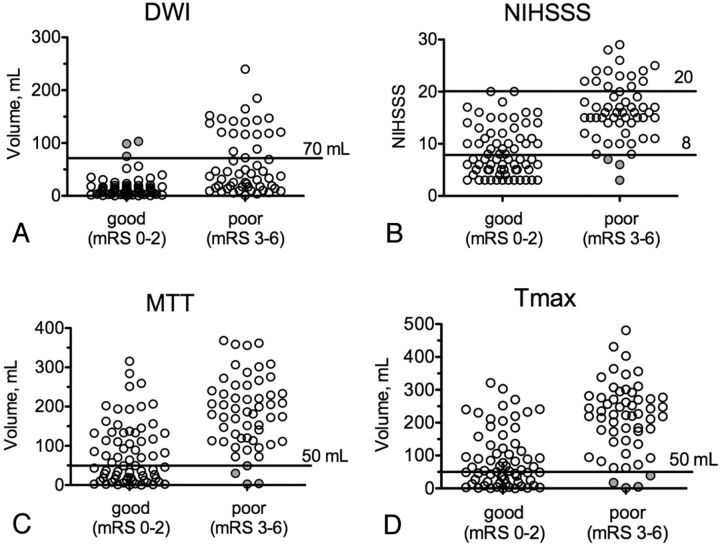
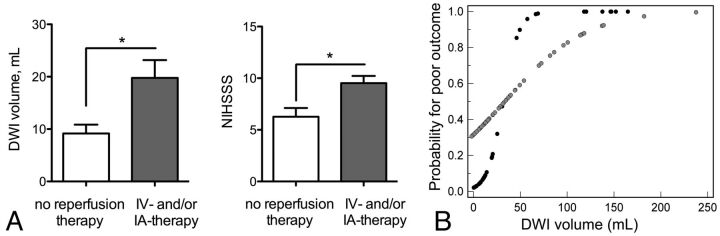
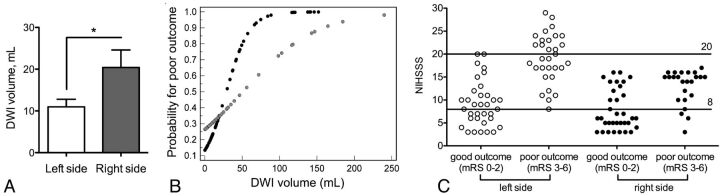
Results: Receiver operating characteristic analysis demonstrated 95.6% and 100% specificity for DWI > 70 mL and NIHSS score > 20 to predict poor outcome, and 92.7% and 91.3% specificity for PWI (mean transit time) < 50 mL and NIHSS score < 8 to predict good outcome. Combining clinical and imaging thresholds led to an 88.8% (71/80) positive predictive value with a 65.0% (80/123) prognostic yield. One hundred percent specific thresholds for DWI (103 versus 31 mL) and NIHSS score (20 versus 17) to predict poor outcome were significantly higher in treated (intravenous and/or intra-arterial) versus untreated patients. Prognostic yield was lower in right- versus left-sided strokes for all thresholds (10.4%-20.7% versus 16.9%-40.0%). Patients with right-sided strokes had higher 100% specific DWI (103.1 versus 74.8 mL) thresholds for poor outcome, and the positive predictive value was lower.
Conclusions: Our predictive model is validated in a much larger patient cohort. Outcome may be predicted in up to two-thirds of patients, and thresholds are affected by stroke side and reperfusion therapy.
© 2015 by American Journal of Neuroradiology.
Figures
Similar articles
-
Combining acute diffusion-weighted imaging and mean transmit time lesion volumes with National Institutes of Health Stroke Scale Score improves the prediction of acute stroke outcome.Stroke. 2010 Aug;41(8):1728-35. doi: 10.1161/STROKEAHA.110.582874. Epub 2010 Jul 1. Stroke. 2010. PMID: 20595665
-
Is the association of National Institutes of Health Stroke Scale scores and acute magnetic resonance imaging stroke volume equal for patients with right- and left-hemisphere ischemic stroke?Stroke. 2002 Apr;33(4):954-8. doi: 10.1161/01.str.0000013069.24300.1d. Stroke. 2002. PMID: 11935043
-
Clinical-diffusion mismatch defined by NIHSS and ASPECTS in non-lacunar anterior circulation infarction.J Neurol. 2007 Mar;254(3):340-6. doi: 10.1007/s00415-006-0368-8. Epub 2007 Mar 7. J Neurol. 2007. PMID: 17345045
-
[Intravenous administration of a tissue plasminogen activator beyond 3 hours of the onset of acute ischemic stroke--MRI-based decision making].Brain Nerve. 2008 Oct;60(10):1173-80. Brain Nerve. 2008. PMID: 18975605 Review. Japanese.
-
Computed tomography and magnetic resonance perfusion imaging in ischemic stroke: definitions and thresholds.Ann Neurol. 2011 Sep;70(3):384-401. doi: 10.1002/ana.22500. Epub 2011 Jul 27. Ann Neurol. 2011. PMID: 21796665 Review.
Cited by
-
Magnetic resonance post-contrast vascular hyperintensities at 3 T: a new highly sensitive sign of vascular occlusion in acute ischaemic stroke.Eur Radiol. 2018 Jul;28(7):2903-2913. doi: 10.1007/s00330-018-5312-7. Epub 2018 Feb 9. Eur Radiol. 2018. PMID: 29426989
-
Clinical effect of minimally invasive aspiration and drainage of intracranial hematoma in the treatment of cerebral hemorrhage.Pak J Med Sci. 2022 Jan-Feb;38(1):95-99. doi: 10.12669/pjms.38.1.4618. Pak J Med Sci. 2022. PMID: 35035407 Free PMC article.
-
Distance to thrombus on MR angiography predicts outcome of middle cerebral artery occlusion treated with IV thrombolysis.Neuroradiology. 2015 Oct;57(10):991-7. doi: 10.1007/s00234-015-1558-9. Epub 2015 Jul 11. Neuroradiology. 2015. PMID: 26162293
-
MRI patient selection for endovascular thrombectomy in acute ischemic stroke: correlation between pretreatment diffusion weighted imaging and outcome scores.Radiol Med. 2018 Aug;123(8):609-617. doi: 10.1007/s11547-018-0887-2. Epub 2018 Apr 16. Radiol Med. 2018. PMID: 29663187
-
[Maximal infarct volume to benefit from intravenous thrombolysis and its relation with onset to treatment time].Zhejiang Da Xue Xue Bao Yi Xue Ban. 2017 Jul 25;46(4):384-389. doi: 10.3785/j.issn.1008-9292.2017.08.07. Zhejiang Da Xue Xue Bao Yi Xue Ban. 2017. PMID: 29256227 Free PMC article. Chinese.
References
-
- Tissue plasminogen activator for acute ischemic stroke: the National Institute of Neurological Disorders and Stroke rt-PA Stroke Study Group. N Engl J Med 1995;333:1581–87 - PubMed
-
- Hacke W, Kaste M, Bluhmki E, et al. . Thrombolysis with alteplase 3 to 4.5 hours after acute ischemic stroke. N Engl J Med 2008;359:1317–29 - PubMed
-
- Cocho D, Belvis R, Marti-Fabregas J, et al. . Reasons for exclusion from thrombolytic therapy following acute ischemic stroke. Neurology 2005;64:719–20 - PubMed
-
- Schlaug G, Benfield A, Baird AE, et al. . The ischemic penumbra: operationally defined by diffusion and perfusion MRI. Neurology 1999;53:1528–37 - PubMed
-
- Davis SM, Donnan GA, Parsons MW, et al. . Effects of alteplase beyond 3 h after stroke in the Echoplanar Imaging Thrombolytic Evaluation Trial (EPITHET): a placebo-controlled randomised trial. Lancet Neurol 2008;7:299–309 - PubMed
Publication types
MeSH terms
Grants and funding
LinkOut - more resources
Full Text Sources
Other Literature Sources
Medical