. 2014 Dec;198(4):1699-716.
doi: 10.1534/genetics.114.169979. Epub 2014 Sep 25.

A foundation for provitamin A biofortification of maize: genome-wide association and genomic prediction models of carotenoid levels

Affiliations

A foundation for provitamin A biofortification of maize: genome-wide association and genomic prediction models of carotenoid levels

Brenda F Owens et al. Genetics. 2014 Dec.

Abstract

Efforts are underway for development of crops with improved levels of provitamin A carotenoids to help combat dietary vitamin A deficiency. As a global staple crop with considerable variation in kernel carotenoid composition, maize (Zea mays L.) could have a widespread impact. We performed a genome-wide association study (GWAS) of quantified seed carotenoids across a panel of maize inbreds ranging from light yellow to dark orange in grain color to identify some of the key genes controlling maize grain carotenoid composition. Significant associations at the genome-wide level were detected within the coding regions of zep1 and lut1, carotenoid biosynthetic genes not previously shown to impact grain carotenoid composition in association studies, as well as within previously associated lcyE and crtRB1 genes. We leveraged existing biochemical and genomic information to identify 58 a priori candidate genes relevant to the biosynthesis and retention of carotenoids in maize to test in a pathway-level analysis. This revealed dxs2 and lut5, genes not previously associated with kernel carotenoids. In genomic prediction models, use of markers that targeted a small set of quantitative trait loci associated with carotenoid levels in prior linkage studies were as effective as genome-wide markers for predicting carotenoid traits. Based on GWAS, pathway-level analysis, and genomic prediction studies, we outline a flexible strategy involving use of a small number of genes that can be selected for rapid conversion of elite white grain germplasm, with minimal amounts of carotenoids, to orange grain versions containing high levels of provitamin A.

Keywords: biofortification; carotenoid; genome-wide association study; genomic prediction; pathway-level analysis; provitamin A.


Figures

Figure 1
Figure 1
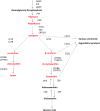
Carotenoid biosynthesis and degradation pathways. Compounds derived from this pathway are diagrammed as nodes in boldface type, with compounds measured in this study shown in red type. Enzymes known to be involved in the conversion of these compounds are adjacent to node connectors. Solid arrows represent single reactions; dashed arrows represent two or more reactions. Note that for some steps maize contains multiple paralogs for a reaction. Note that, in Arabidopsis, the CCD class of enzymes has been shown to degrade additional carotenoid compounds (Gonzalez-Jorge et al. 2013). DOXP, 1-deoxy-d-xylulose 5-phosphate synthase; IPP, isopentenyl pyrophosphate synthase; GGPP, geranylgeranyl pyrophosphate synthase; PSY, phytoene synthase; PDS, phytoene desaturase; Z-ISO, ζ-carotene isomerase; ZDS, ζ-carotene desaturase; CRTISO, carotenoid isomerase; LCYE, lycopene ε-cyclase; LCYB, lycopene β-cyclase; CYP97A, β-carotene hydroxylase (P450); CYP97C, ε-carotene hydroxylase (P450); CRTRB, β-carotene hydroxylase; VDE, violaxanthin de-epoxidase; ZEP, zeaxanthin epoxidase; CCD1, carotenoid cleavage dioxygenase 1.
Figure 2
Figure 2
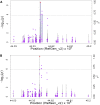
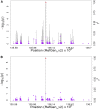
GWAS for zeaxanthin content in maize grain. (A) Scatter plot of association results from a unified mixed model analysis of zeaxanthin and LD estimates (r2) across the zep1 chromosome region. Negative log10-transformed P-values (left y-axis) from a GWAS for zeaxanthin and r2 values (right y-axis) are plotted against physical position (B73 RefGen_v2) for a 1.2-Mb region on chromosome 2 that encompasses zep1. The blue vertical lines are –log10 P-values for SNPs that are statistically significant for zeaxanthin at 5% FDR, while the gray vertical lines are –log10 P-values for SNPs that are nonsignificant at 5% FDR. Triangles are the r2 values of each SNP relative to the peak SNP (indicated in red) at 44,448,432 bp. The black horizontal dashed line indicates the –log10 P-value of the least statistically significant SNP at 5% FDR. The black vertical dashed lines indicate the start and stop positions of zep1 (GRMZM2G127139). (B) Scatter plot of association results from a conditional unified mixed model analysis of zeaxanthin and LD estimates (r2) across the zep1 chromosome region, as in A. The peak SNP from the unconditional GWAS (S2_44448432; 44,448,432 bp) was included as a covariate in the unified mixed model to control for the zep1 effect.
Figure 3
Figure 3
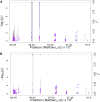
GWAS for the ratio of α-carotene to zeinoxanthin content in maize grain. (A) Scatter plot of association results from a unified mixed model analysis of the ratio of α-carotene to zeinoxanthin and LD estimates (r2) across the lut1 chromosome region. Negative log10-transformed P-values (left y-axis) from a GWAS for the ratio of α-carotene to zeinoxanthin and r2 values (right y-axis) are plotted against physical position (B73 RefGen_v2) for a 1-Mb region on chromosome 1 that encompasses lut1. The blue vertical lines are –log10 P-values for SNPs that are statistically significant for the ratio of α-carotene to zeinoxanthin at 5% FDR, while the gray vertical lines are –log10 P-values for SNPs that are nonsignificant at 5% FDR. Triangles are the r2 values of each SNP relative to the peak SNP (indicated in red) at 86,844,203 bp. The black horizontal dashed line indicates the –log10 P-value of the least statistically significant SNP at 5% FDR. The black vertical dashed lines indicate the start and stop positions of lut1 (GRMZM2G14322.) (B) Scatter plot of association results from a conditional unified mixed model analysis of the ratio of α-carotene to zeinoxanthin and LD estimates (r2) across the lut1 chromosome region, as in A. The peak SNP from the unconditional GWAS (ss196425306; 86,844,203 bp) was included as a covariate in the unified mixed model to control for the lut1 effect.
Figure 4
Figure 4
GWAS for the ratio of β-xanthophylls to α-xanthophylls content in maize grain. Scatter plot of association results from a unified mixed model analysis of the ratio of β-xanthophylls to α-xanthophylls and LD estimates (r2) across the lcyE chromosome region. Negative log10-transformed P-values (left y-axis) from a GWAS for the ratio of β-xanthophylls to α-xanthophylls and r2 values (right y-axis) are plotted against physical position (B73 RefGen_v2) for a 12-Mb region on chromosome 8 that encompasses lcyE. The blue vertical lines are –log10 P-values for SNPs that are statistically significant for the ratio of β-xanthophylls to α-xanthophylls at 5% FDR, while the gray vertical lines are –log10 P-values for SNPs that are nonsignificant at 5% FDR. Triangles are the r2 values of each SNP relative to the peak SNP (indicated in red) at 138,883,206 bp. The black horizontal dashed line indicates the –log10 P-value of the least statistically significant SNP at 5% FDR. The black vertical dashed lines indicate the start and stop positions of lcyE (GRMZM2G12966). (B) Scatter plot of association results from a conditional unified mixed model analysis of the ratio of β-xanthophylls to α-xanthophylls and LD estimates (r2) across the lcyE chromosome region, as in A. The two SNPs (lcyE SNP216 and S_138882897) from the optimal MLMM model were included as covariates in the unified mixed model to control for the lcyE effect.
Figure 5
Figure 5
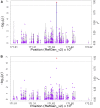
GWAS for total β-xanthophylls content in maize grain. (A) Scatter plot of association results from a unified mixed model analysis of total β-xanthophylls and LD estimates (r2) across the surrounding chromosome region. Negative log10-transformed P-values (left y-axis) from a GWAS for total β-xanthophylls and r2 values (right y-axis) are plotted against physical position (B73 RefGen_v2) for a 1.2-Mb region on chromosome 8. The blue vertical lines are –log10 P-values for SNPs that are statistically significant for total β-xanthophylls at 5% FDR, while the gray vertical lines are –log10 P-values for SNPs that are nonsignificant at 5% FDR. Triangles are the r2 values of each SNP relative to the peak SNP (indicated in red) at 171,705,574 bp. The black horizontal dashed line indicates the –log10 P-value of the least statistically significant SNP at 5% FDR. (B) Scatter plot of association results from a conditional unified mixed model analysis of total β-xanthophyll and LD estimates (r2) across the 1.2-Mb chromosome region, as in A. The peak SNP from the unconditional GWAS (S8_171705574; 171,705,574 bp) was included as a covariate in the unified mixed model to control for the novel effect detected on chromosome 8.
Figure 6
Figure 6
GWAS for the ratio of β-carotene to β-cryptoxanthin plus zeaxanthin content in maize grain. (A) Scatter plot of association results from a unified mixed model analysis of the ratio of β-carotene to β-cryptoxanthin plus zeaxanthin and LD estimates (r2) across the crtRB1 chromosome region. Negative log10-transformed P-values (left y-axis) from a GWAS for the ratio of β-carotene to β-cryptoxanthin plus zeaxanthin and r2 values (right y-axis) are plotted against physical position (B73 RefGen_v2) for a 1.2-Mb region on chromosome 10 that encompasses crtRB1. The vertical lines are –log10 P-values for all tested SNPs in this region. Triangles are the r2 values of each SNP relative to the peak polymorphism (indicated in red) at 136,059,748 bp. The black vertical dashed lines indicate the start and stop positions of crtRB1 (GRMZM2G152135). (B) Scatter plot of association results from a conditional unified mixed model analysis of the ratio of β-carotene to β-cryptoxanthin plus zeaxanthin and LD estimates (r2) across the crtRB1 chromosome region, as in A. The peak polymorphism from the unconditional GWAS (crtRB1 InDel4; 136,059,748 bp) was included as a covariate in the unified mixed model to control for the crtRB1 effect.
Figure 7
Figure 7
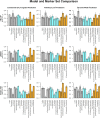
Comparison of genomic prediction methods and marker sets for 15 grain carotenoid traits. Three prediction methods—RR-BLUP, LASSO, and elastic net analysis—were tested using three marker sets as predictors: carotenoid QTL-targeted prediction (the 944 markers and seven indels within ±250 kb of 8 a priori candidate genes), pathway-level prediction (the 7408 markers and seven indels within ±250 kb of 58 a priori candidate genes), and genome-wide prediction (all 284,180 markers and 7 indels used in genome-wide association studies). Standardized average correlations resulting from the fivefold cross-validation are reported. A superscript “a” (a) indicates that no markers were selected in one or two of the five folds or in three of the five folds in one case (α-carotene using the Pathway-Level Prediction marker set in eNet.)

Similar articles

Cited by

References

    1. Abdel-Aal E. M., Akhtar H., Zaheer K., Ali R., 2013. Dietary sources of lutein and zeaxanthin carotenoids and their role in eye health. Nutrients 5: 1169–1185. - PMC - PubMed
    1. Azmach G., Gedil M., Menkir A., Spillane C., 2013. Marker-trait association analysis of functional gene markers for provitamin A levels across diverse tropical yellow maize inbred lines. BMC Plant Biol. 13: 227. - PMC - PubMed
    1. Babu R., Rojas N. P., Gao S. B., Yan J. B., Pixley K., 2013. Validation of the effects of molecular marker polymorphisms in LcyE and CrtRB1 on provitamin A concentrations for 26 tropical maize populations. Theor. Appl. Genet. 126: 389–399. - PMC - PubMed
    1. Baranzini S. E., Galwey N. W., Wang J., Khankhanian P., Lindberg R., et al. , 2009. Pathway and network-based analysis of genome-wide association studies in multiple sclerosis. Hum. Mol. Genet. 18: 2078–2090. - PMC - PubMed
    1. Benjamini Y., Hochberg Y., 1995. Controlling the false discovery rate: a practical and powerful approach to multiple testing. J. R. Stat. Soc. Series B Stat. Methodol. 57: 289–300.

Publication types