. 2014 Nov;24(11):1774-86.
doi: 10.1101/gr.177790.114. Epub 2014 Sep 25.

Widespread intron retention in mammals functionally tunes transcriptomes

Affiliations

Widespread intron retention in mammals functionally tunes transcriptomes

Ulrich Braunschweig et al. Genome Res. 2014 Nov.

Abstract

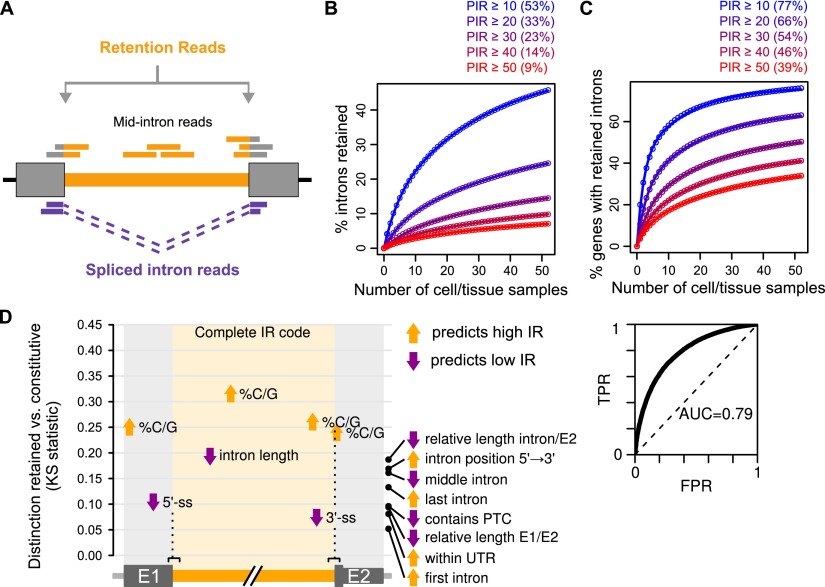
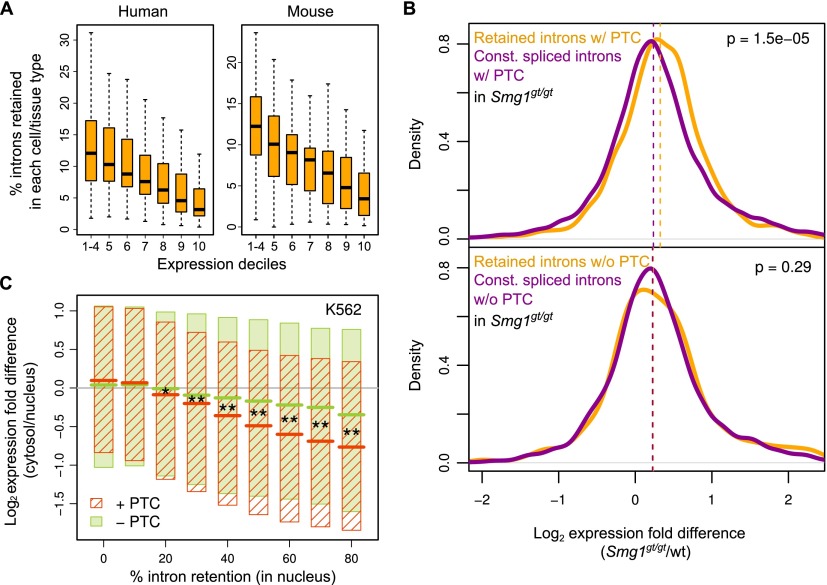
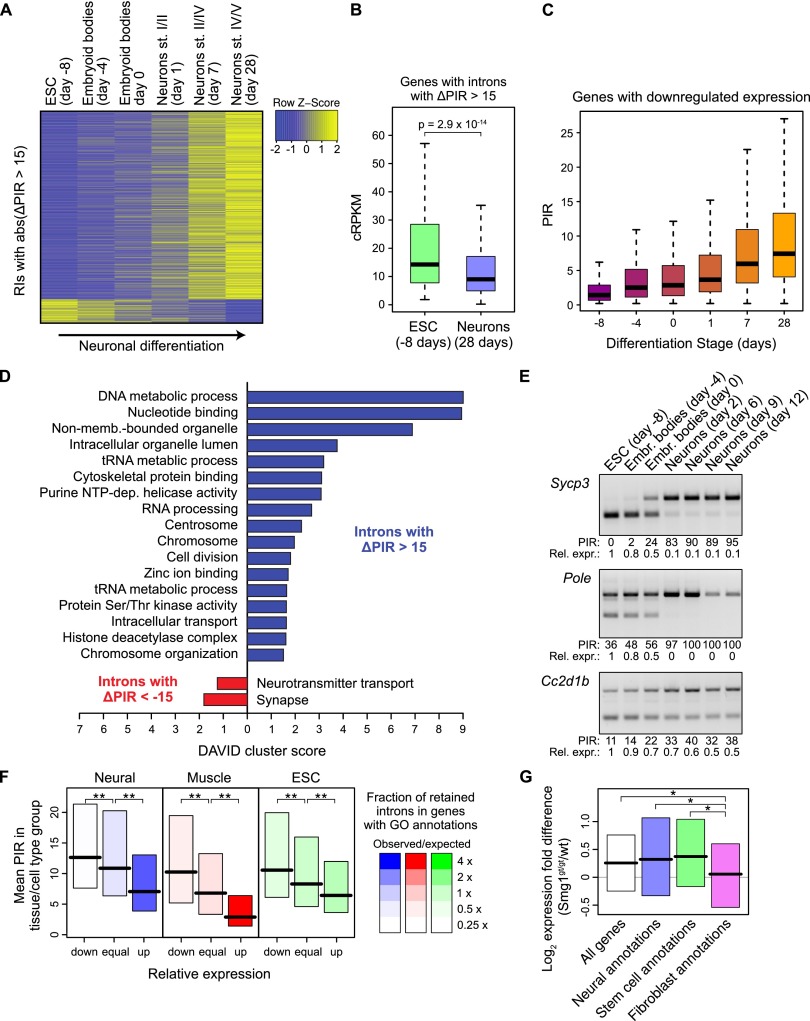
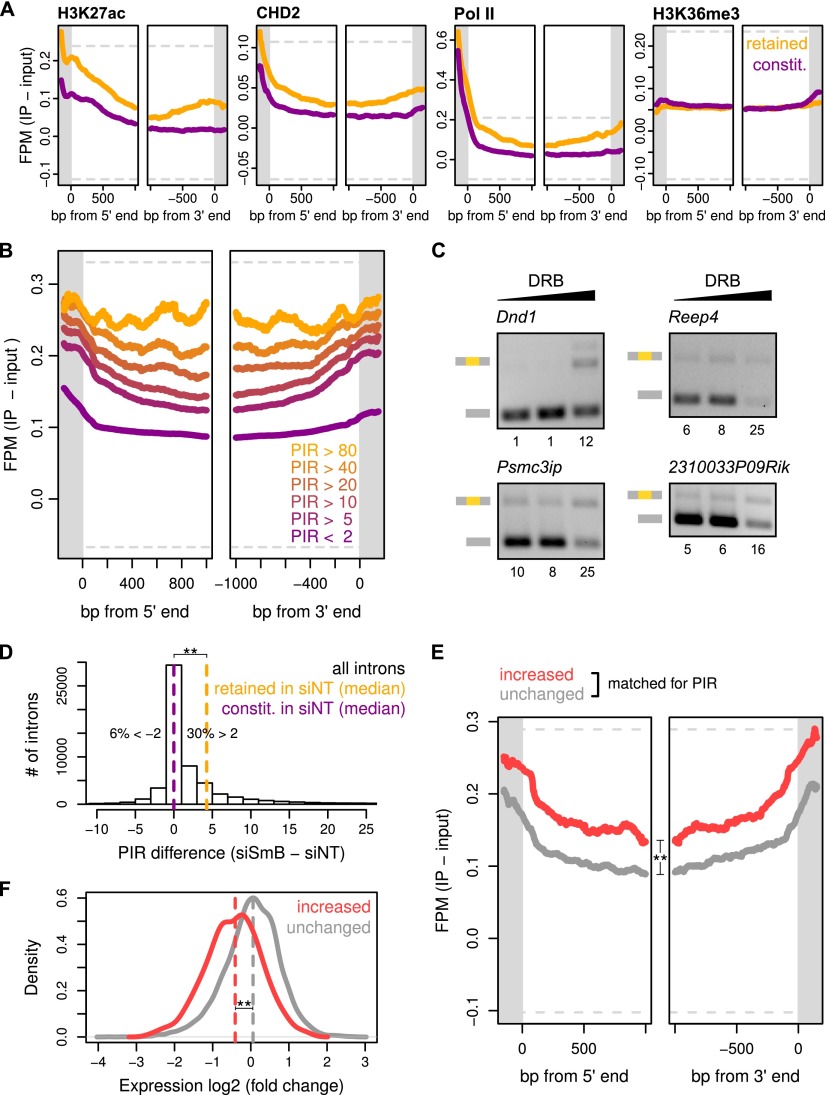
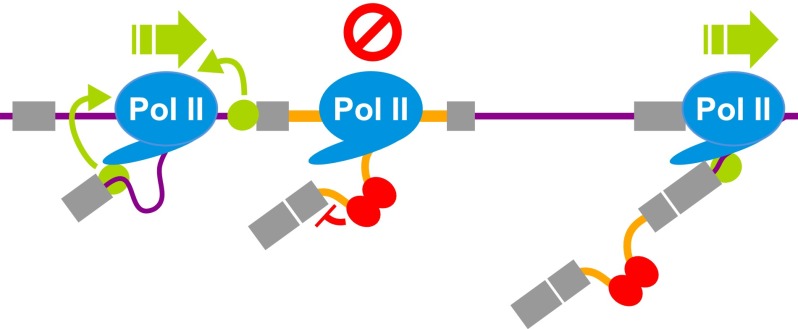
Alternative splicing (AS) of precursor RNAs is responsible for greatly expanding the regulatory and functional capacity of eukaryotic genomes. Of the different classes of AS, intron retention (IR) is the least well understood. In plants and unicellular eukaryotes, IR is the most common form of AS, whereas in animals, it is thought to represent the least prevalent form. Using high-coverage poly(A)(+) RNA-seq data, we observe that IR is surprisingly frequent in mammals, affecting transcripts from as many as three-quarters of multiexonic genes. A highly correlated set of cis features comprising an "IR code" reliably discriminates retained from constitutively spliced introns. We show that IR acts widely to reduce the levels of transcripts that are less or not required for the physiology of the cell or tissue type in which they are detected. This "transcriptome tuning" function of IR acts through both nonsense-mediated mRNA decay and nuclear sequestration and turnover of IR transcripts. We further show that IR is linked to a cross-talk mechanism involving localized stalling of RNA polymerase II (Pol II) and reduced availability of spliceosomal components. Collectively, the results implicate a global checkpoint-type mechanism whereby reduced recruitment of splicing components coupled to Pol II pausing underlies widespread IR-mediated suppression of inappropriately expressed transcripts.


Figures

Figure 1.
Figure 1.
Detection and prevalence of intron retention. (A) Intron retention was detected by aligning RNA-seq reads to comprehensive sets of exon–intron and exon–exon junctions. Reads mapping to mid-intron sequences and balanced counts of reads aligning to upstream and downstream exon–intron sequences were used to discriminate IR from other forms of transcript variation. IR levels were measured using percent intron retention (PIR): 100× mean retention reads over the sum of retention and spliced intron reads (see Methods for details). (B) Percentage of total human introns detected as retained at different PIR thresholds as increasing numbers of cell and tissue samples are randomly sampled. Numbers in parentheses are estimates for percentages of total introns retained at different PIR thresholds, as derived from extrapolation. (Circles) Means from 1,000 iterations; (lines) fitted function used for extrapolation (see Methods). Data for mouse introns in Supplemental Figure S1C. (C) Percentage of total human genes with retained introns at different PIR thresholds as increasing numbers of cell and tissue samples are randomly sampled. Numbers in parentheses are estimates for percentages of total genes with retained introns at different PIR thresholds, as derived from extrapolation. Circles and lines as in B; data for mouse genes in Supplemental Figure S1D. (D) Cis-acting features predictive of IR in human. The main graph quantifies, using the Kolmogorov-Smirnov statistic, how well individual features or a logistic regression model comprising 136 features (“Complete IR code”) (Supplemental Table S2) distinguish retained (PIR ≥ 10) from constitutive (PIR < 2) introns in neural tissues. See Methods for details. The graph on the upper right shows the receiver operating characteristic of the complete IR code with area under the curve (AUC) indicated. (TPR) True positive rate; (FPR) false positive rate. E1/E2 are 5′/3′ exons, respectively.
Figure 2.
Figure 2.
Distinct types of retained introns and associated properties. (A) Classification of retained introns and associated properties. (B) Fractions of total human retained introns belonging to each evolutionary type at different PIR thresholds. Represented are introns that could be assigned as Type A–C and that are retained at the indicated PIR thresholds in ≥10% of the samples. (C) Cumulative distribution of median PIR levels for each retained intron type in human cells and tissues. Only introns where PIR could be determined in ≥10% of the samples are represented. (D) Comparison of donor splice site strength (measured using maximum entropy; see Methods) of human retained introns and of constitutively spliced introns. Retained introns compared have PIR ≥ 10 in ≥10% of the samples where PIR could be determined; constitutively spliced introns have PIR < 2 in all samples where PIR could be determined. (Asterisks) P < 0.001 in two-sided Mann-Whitney U test. (E) Fraction of all human introns in each genic region that is retained with PIR ≥ 10 in ≥10% of the samples where PIR could be determined. (UTR) Untranslated region; (CDS) coding region of gene; (PTC) premature termination codon that can elicit nonsense-mediated mRNA decay. The total number of retained introns in each region is indicated.
Figure 3.
Figure 3.
Tissue-specific evolutionary conservation of IR across vertebrates. (A) Proportion of total orthologous introns retained (PIR ≥ 10) in an organ of one species that are also retained in the same organ of another of 11 vertebrate species being compared (see main text and panel B). Lines connect average values for each evolutionary distance. Asterisks indicate significance of differences between each organ and the average of all other organs (*) P < 0.05; (**) P < 0.001 (see Methods for details). (B) Hierarchical clustering of the same vertebrate species’ tissue samples in A, based on comparison of PIR values. Only introns with an intra-species PIR range ≥ 10 in at least three species are compared (n = 4835). (White) Missing data for nonconserved introns.
Figure 4.
Figure 4.
Global regulation of mRNA levels through IR. (A) Box plots showing distributions of percentages of total human and mouse introns detected as retained (PIR ≥ 10) in transcripts sorted into 10 different expression level bins (deciles, with deciles 1–4 averaged). (B) Distributions of expression difference between Smg1gt/gt and wild-type MEFs for transcripts harboring introns predicted to introduce a PTC that can trigger NMD upon retention (top), and for transcripts harboring introns that are predicted not to introduce a PTC (bottom). In each panel, retained (PIR ≥ 10) and constitutively (PIR < 2) spliced introns are compared. P-value indicates significance of expression change difference (one-sided Mann-Whitney U test). (C) Expression difference between cytosolic and nuclear fractions of K562 cells for transcripts that do or do not contain PTC-introducing introns, as measured at different PIR thresholds in the nuclear fraction (see also Supplemental Fig. S6C). Shaded boxes indicate upper and lower quartiles of distributions of expression level differences, and colored lines indicate median values. Expression-level differences for transcripts harboring retained introns that do or do not introduce PTCs are indicated by red and green, respectively. Asterisks indicate significance of difference between median values for expression level differences for transcripts with and without PTC-introducing retained introns (*) P < 0.05; (**) P < 0.001 (one-sided Mann-Whitney U tests after Bonferroni correction). See also Supplemental Figure S7B.
Figure 5.
Figure 5.
IR-mediated tuning of gene expression. (A) Heatmap of Z-scores for introns differentially retained during differentiation of ES cells into mature glutamatergic neurons. Z-scores are shown for retained introns with a change in PIR (ΔPIR) > 15 between ES cells and mature neurons (day 28). (B) Distribution of expression values (in cRPKM) in ES cells and mature neurons for genes that contain introns with increased retention during differentiation. (C) Distributions of PIR of introns in genes whose expression is down-regulated (more than fivefold between day −8 and day 28) at different time points of neuronal differentiation. (D) DAVID cluster analysis of enriched GO annotations for genes that contain introns with increased (blue) or decreased (red) retention during neuronal differentiation. (E) RT-PCR validation of RNA-seq–detected events with increasing PIR and decreasing spliced mRNA expression during differentiation of glutamatergic neurons from mouse ES cells. Quantification of PIR and the mRNA expression are shown beneath each panel. For relative expression, the spliced band was quantified and normalized to Gapdh, and day −8 was set to 1. See Supplemental Figure S8 for the full set of 11 tested events. (F) Relationship between the degree of IR and cell type-specific expression of genes annotated with cell/tissue-specific functions. Bars show the upper and lower quartile, and black lines the medians, of the PIR difference between neural and other cell/tissue types (left), muscle and other cell/tissue types (middle), and ESCs and other cell/tissue types (right). Intron PIR was measured in sets of genes assigned to equal-sized bins (three bars) based on having decreased (down), equivalent (equal), or increased (up) expression, as compared to the median expression values for the other cell types. Shading indicates the degree of enrichment of GO categories related to the biology of neural, muscle, and stem cells, respectively (see Methods for details). Asterisks indicate P < 0.001 in one-sided Mann-Whitney U tests after Bonferroni correction. (G) Expression difference between Smg1gt/gt and wild-type MEFs for transcripts harboring retained introns predicted to introduce a PTC that can trigger NMD, in genes associated with GO categories related to the biology of neural cells, stem cells, and fibroblasts. Asterisks indicate a significant difference between median values for expression level differences (P < 0.05 in one-sided Mann-Whitney U tests after Bonferroni correction).
Figure 6.
Figure 6.
Coupling between IR and RNA Pol II elongation. (A) Average ChIP-seq signals across introns that are retained (orange, PIR ≥ 10) or not retained (purple, PIR < 2) in K562 cells, for four of 129 analyzed human chromatin features. Retained and not retained introns analyzed are in genes with matched expression levels. (Gray bars) Flanking exons; (y-axes) input-subtracted average ChIP fragment density per million reads (FPM-input) at each aligned bp; (gray dashed lines) 2nd and 98th percentiles of all values in the plot region before averaging to give an indication of the dynamic range. See Supplemental Figure S9A for similar analysis in mouse CH12 cells. (B) Average ChIP-seq signal of Ser2-phosphorylated RNA Pol II over introns with different PIR thresholds in K562 cells. Labels and plots as in A. See Supplemental Figure S9B for similar analysis in mouse CH12 cells. (C) RT-PCR assays of IR events in CGR8 mouse ES cells with and without treatment with the RNA Pol II elongation inhibitor DRB. Retained introns with low PIR in ES cells relative to other cell types were analyzed. (Lane 1) 0 μg/mL DRB; (lane 2) 10 μg/mL; (lane 3) 25 μg/mL. Quantitations are shown beneath each panel. See Supplemental Figure S10 for the full set of tested introns. (D) Number of introns with PIR changes in HeLa cells transfected with siRNAs targeting SNRPB, which codes for SmB/B′, relative to cells transfected with a control, nontargeting siRNA (Saltzman et al. 2011). (Dashed lines) Medians of retained (PIR ≥ 10) and constitutive (PIR < 2) introns in control treated cells; (asterisks) P < 0.001 between these groups (one-sided Mann-Whitney U test). (E) RNA Pol II occupancy over introns (in untreated HeLa cells) that become more retained (PIR difference > 15, red) or that do not change (PIR difference between −2 and +2, gray) after SNRPB knockdown. Because RNA Pol II occupancy is dependent on absolute PIR, groups of introns with matching PIR distributions in control treated cells and >2 kb away from the transcription start site are shown. (Asterisks) P < 0.001 for difference in median Pol II-Ser2p occupancy (see Methods for test details). (F) Expression change between SNRPB and control knockdown for genes containing introns that become more retained (PIR difference > 15, red) or that do not change (PIR difference between −2 and +2, gray). (Asterisks) P < 0.001 between these groups (one-sided Mann-Whitney U test).
Figure 7.
Figure 7.
Mechanistic model for gene regulation via coupling between IR and RNA Pol II elongation. Inaccurate cell/tissue-specific transcription leads to low levels of expression and reduced recruitment of splicing factors to nascent transcripts. Weak splice sites and/or other cis features associated with retained introns leads to their retention. Binding of basal splicing components such as U1 snRNP (green circle) to the 5′ splice site of constitutive introns promotes Pol II elongation (Fong and Zhou 2001; Alexander et al. 2010), whereas the absence of recruitment of such factors promotes IR and reduces RNA Pol II elongation. Reduced Pol II elongation may further promote and commit introns to retention by favoring binding of splicing repressive factors (red ovals).

Similar articles

Cited by

References

    1. Alexander RD, Innocente SA, Barrass JD, Beggs JD. 2010. Splicing-dependent RNA polymerase pausing in yeast. Mol Cell 40: 582–593 - PMC - PubMed
    1. Amit M, Donyo M, Hollander D, Goren A, Kim E, Gelfman S, Lev-Maor G, Burstein D, Schwartz S, Postolsky B, et al. . 2012. Differential GC content between exons and introns establishes distinct strategies of splice-site recognition. Cell Rep 1: 543–556 - PubMed
    1. Ashburner M, Ball CA, Blake JA, Botstein D, Butler H, Cherry JM, Davis AP, Dolinski K, Dwight SS, Eppig JT. 2000. Gene ontology: tool for the unification of biology. The Gene Ontology Consortium. Nat Genet 25: 25–29 - PMC - PubMed
    1. Barbosa-Morais NL, Irimia M, Pan Q, Xiong HY, Gueroussov S, Lee LJ, Slobodeniuc V, Kutter C, Watt S, Colak R, et al. . 2012. The evolutionary landscape of alternative splicing in vertebrate species. Science 338: 1587–1593 - PubMed
    1. Beckers JM, Rixen M. 2003. EOF calculations and data filling from incomplete oceanographic datasets. J Atmos Ocean Technol 20: 1839–1856

Publication types

MeSH terms