

A statistical parametric mapping toolbox used for voxel-wise analysis of FDG-PET images of rat brain
- PMID: 25259529
- PMCID: PMC4178133
- DOI: 10.1371/journal.pone.0108295
A statistical parametric mapping toolbox used for voxel-wise analysis of FDG-PET images of rat brain
Abstract
Purpose: PET (positron emission tomography) imaging researches of functional metabolism using fluorodeoxyglucose (18F-FDG) of animal brain are important in neuroscience studies. FDG-PET imaging studies are often performed on groups of rats, so it is desirable to establish an objective voxel-based statistical methodology for group data analysis.
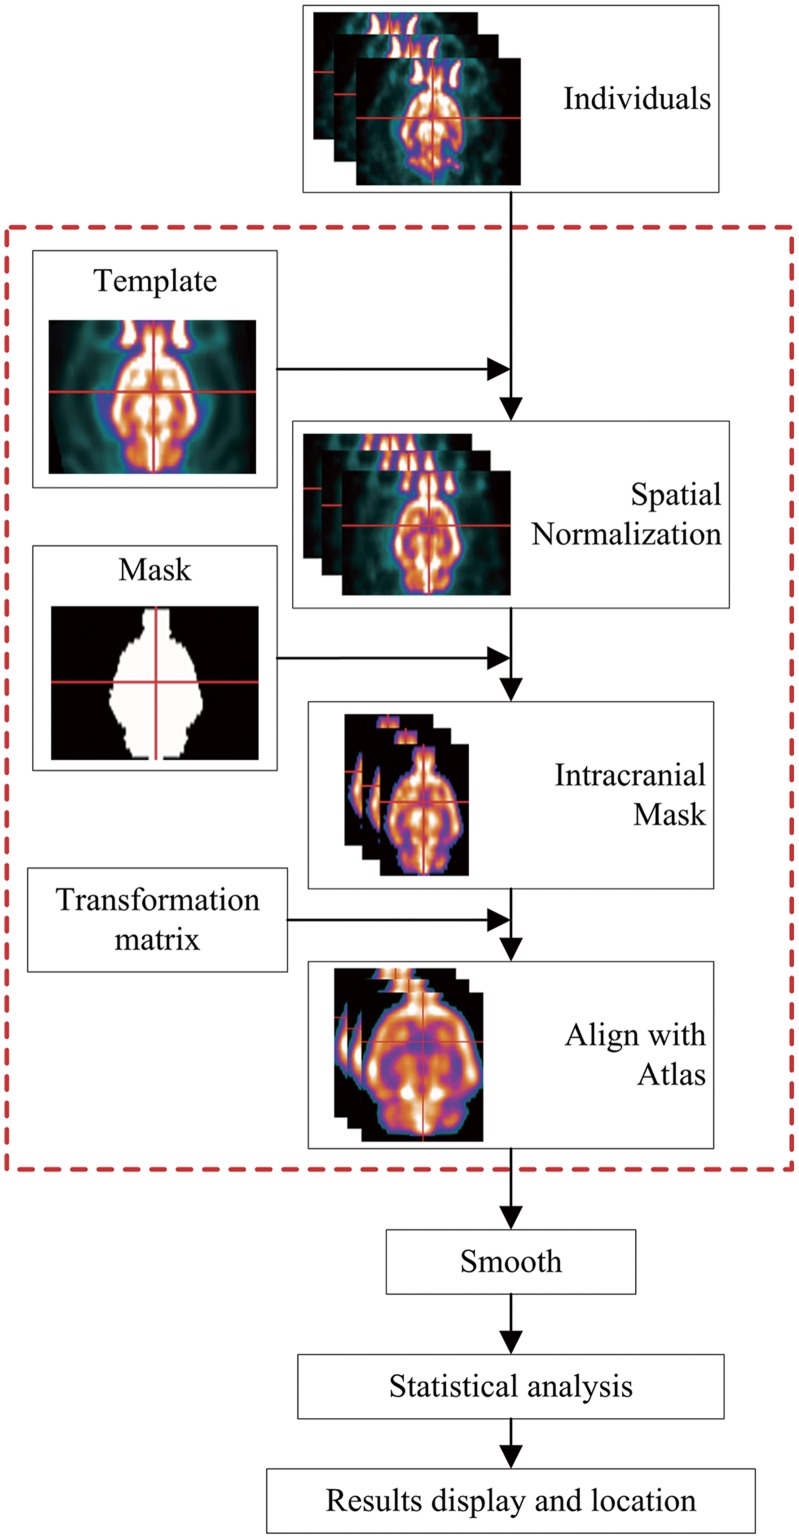
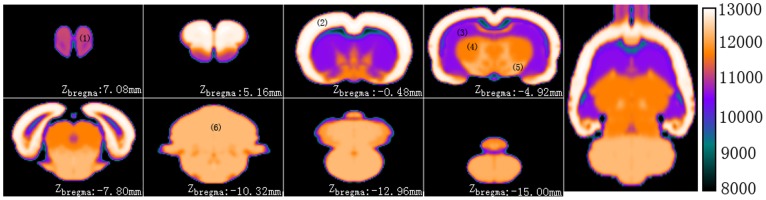
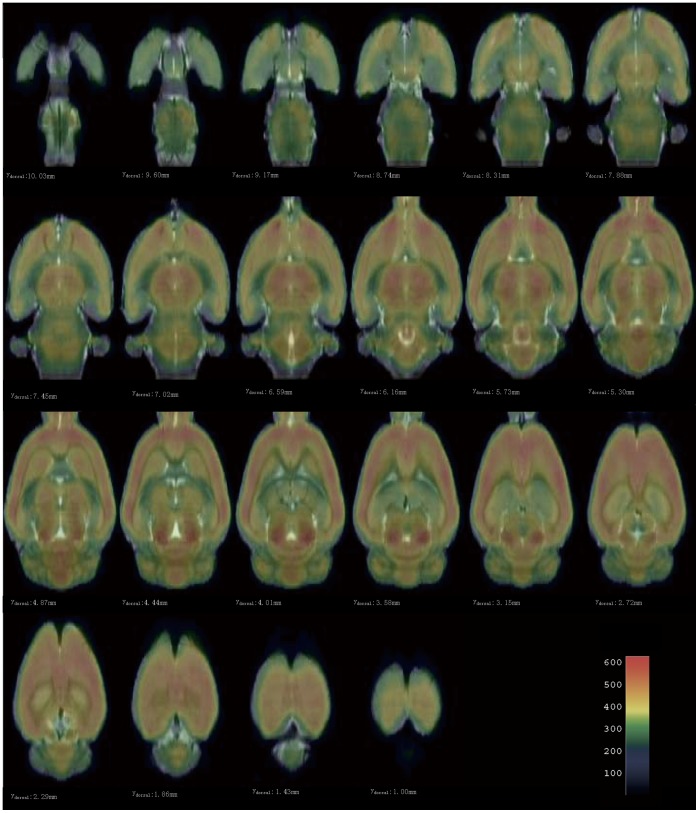
Material and methods: This study establishes a statistical parametric mapping (SPM) toolbox (plug-ins) named spmratIHEP for voxel-wise analysis of FDG-PET images of rat brain, in which an FDG-PET template and an intracranial mask image of rat brain in Paxinos & Watson space were constructed, and the default settings were modified according to features of rat brain. Compared to previous studies, our constructed rat brain template comprises not only the cerebrum and cerebellum, but also the whole olfactory bulb which made the later cognitive studies much more exhaustive. And with an intracranial mask image in the template space, the brain tissues of individuals could be extracted automatically. Moreover, an atlas space is used for anatomically labeling the functional findings in the Paxinos & Watson space. In order to standardize the template image with the atlas accurately, a synthetic FDG-PET image with six main anatomy structures is constructed from the atlas, which performs as a target image in the co-registration.
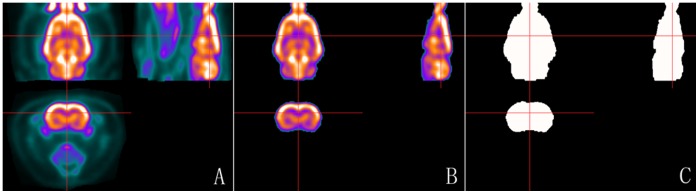
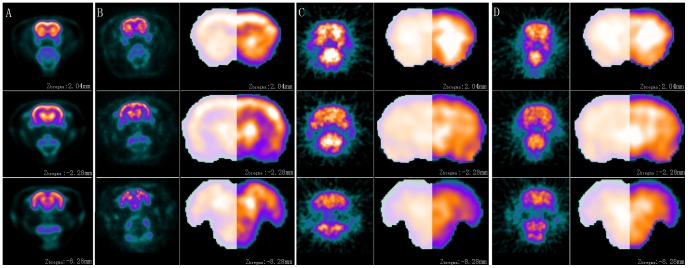
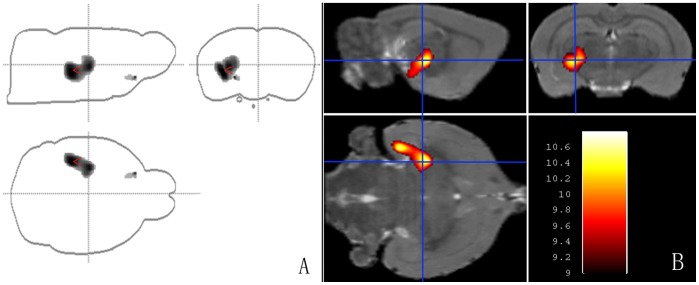
Results: The spatial normalization procedure is evaluated, by which the individual rat brain images could be standardized into the Paxinos & Watson space successfully and the intracranial tissues could also be extracted accurately. The practical usability of this toolbox is evaluated using FDG-PET functional images from rats with left side middle cerebral artery occlusion (MCAO) in comparison to normal control rats. And the two-sample t-test statistical result is almost related to the left side MCA.
Conclusion: We established a toolbox of SPM8 named spmratIHEP for voxel-wise analysis of FDG-PET images of rat brain.
Conflict of interest statement
Figures
Similar articles
-
Construction and evaluation of multitracer small-animal PET probabilistic atlases for voxel-based functional mapping of the rat brain.J Nucl Med. 2006 Nov;47(11):1858-66. J Nucl Med. 2006. PMID: 17079820
-
A rat brain MRI template with digital stereotaxic atlas of fine anatomical delineations in paxinos space and its automated application in voxel-wise analysis.Hum Brain Mapp. 2013 Jun;34(6):1306-18. doi: 10.1002/hbm.21511. Epub 2012 Jan 30. Hum Brain Mapp. 2013. PMID: 22287270 Free PMC article.
-
A standardized [18F]-FDG-PET template for spatial normalization in statistical parametric mapping of dementia.Neuroinformatics. 2014 Oct;12(4):575-93. doi: 10.1007/s12021-014-9235-4. Neuroinformatics. 2014. PMID: 24952892
-
Spatial normalization and quantification approaches of PET imaging for neurological disorders.Eur J Nucl Med Mol Imaging. 2022 Sep;49(11):3809-3829. doi: 10.1007/s00259-022-05809-6. Epub 2022 May 28. Eur J Nucl Med Mol Imaging. 2022. PMID: 35624219 Review.
-
Statistical Voxel-Based Methods and [18F]FDG PET Brain Imaging: Frontiers for the Diagnosis of AD.Curr Alzheimer Res. 2016;13(6):682-94. doi: 10.2174/1567205013666151116142039. Curr Alzheimer Res. 2016. PMID: 26567733 Review.
Cited by
-
Volumetric abnormalities of the brain in a rat model of recurrent headache.Mol Pain. 2018 Jan-Dec;14:1744806918756466. doi: 10.1177/1744806918756466. Epub 2018 Jan 21. Mol Pain. 2018. PMID: 29353541 Free PMC article.
-
Quantitative SPM Analysis Involving an Adaptive Template May Be Easily Applied to [18F]FDG PET Images of the Rat Brain.Mol Imaging Biol. 2017 Oct;19(5):731-735. doi: 10.1007/s11307-016-1043-9. Mol Imaging Biol. 2017. PMID: 28108871
-
Semantic Segmentation of White Matter in FDG-PET Using Generative Adversarial Network.J Digit Imaging. 2020 Aug;33(4):816-825. doi: 10.1007/s10278-020-00321-5. J Digit Imaging. 2020. PMID: 32043177 Free PMC article.
-
18F-THK 5351 and 11C-PiB PET of the Thai normal brain template.Asia Ocean J Nucl Med Biol. 2021 Winter;9(1):21-30. doi: 10.22038/AOJNMB.2020.49623.1338. Asia Ocean J Nucl Med Biol. 2021. PMID: 33392346 Free PMC article.
-
Abnormal Metabolic Connectivity in Rats at the Acute Stage of Ischemic Stroke.Neurosci Bull. 2018 Oct;34(5):715-724. doi: 10.1007/s12264-018-0266-y. Epub 2018 Aug 6. Neurosci Bull. 2018. PMID: 30083891 Free PMC article.
References
-
- Zimmer L, Luxen A (2012) PET radiotracers for molecular imaging in the brain: past, present and future. NeuroImage 61: 363–370. - PubMed
-
- Huang YC, Hsu CC, Huang P, Yin TK, Chiu NT, et al. (2011) The changes in brain metabolism in people with activated brown adipose tissue: a PET study. NeuroImage 54: 142–147. - PubMed
-
- Schweinhardt P, Fransson P, Olson L, Spenger C, Andersson JL (2003) A template for spatial normalisation of MR images of the rat brain. Journal of Neuroscience Methods 129: 105–113. - PubMed
Publication types
MeSH terms
Substances
LinkOut - more resources
Full Text Sources
Other Literature Sources
