. 2014 Nov;64(5):1108-15.
doi: 10.1161/HYPERTENSIONAHA.114.04147. Epub 2014 Aug 4.

Oligoclonal CD8+ T cells play a critical role in the development of hypertension

Affiliations

Oligoclonal CD8+ T cells play a critical role in the development of hypertension

Daniel W Trott et al. Hypertension. 2014 Nov.

Abstract

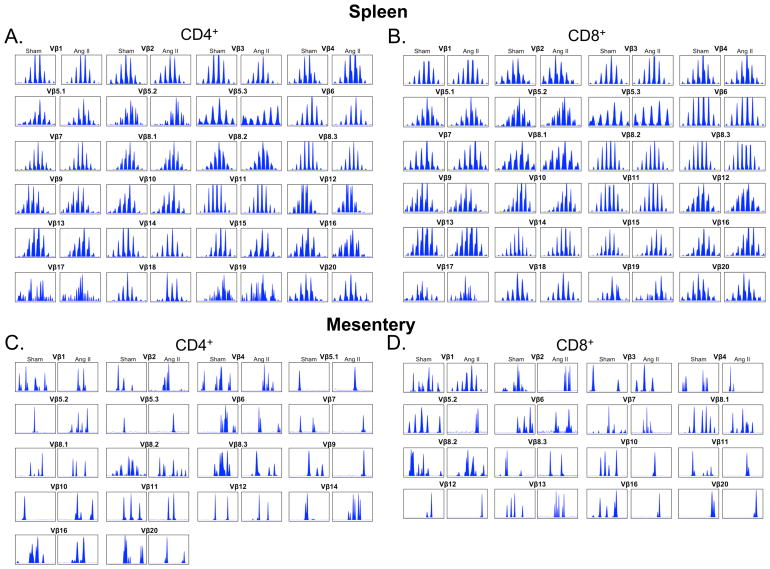
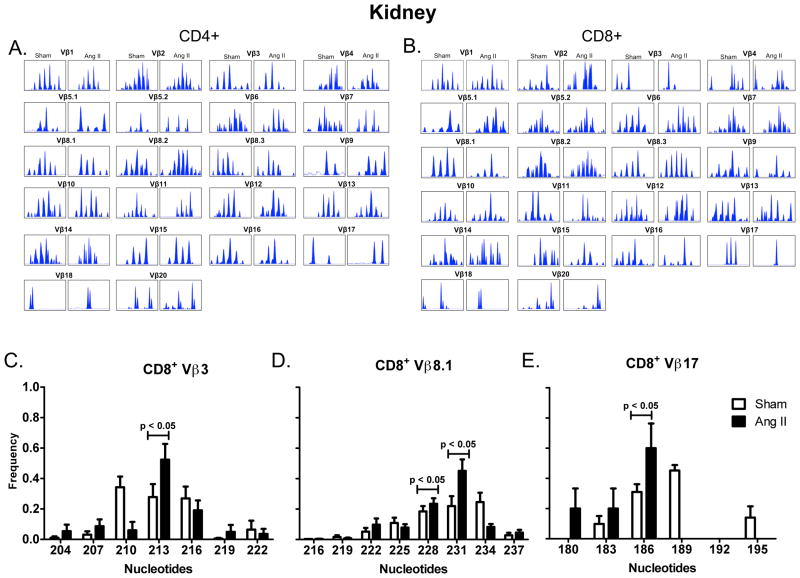
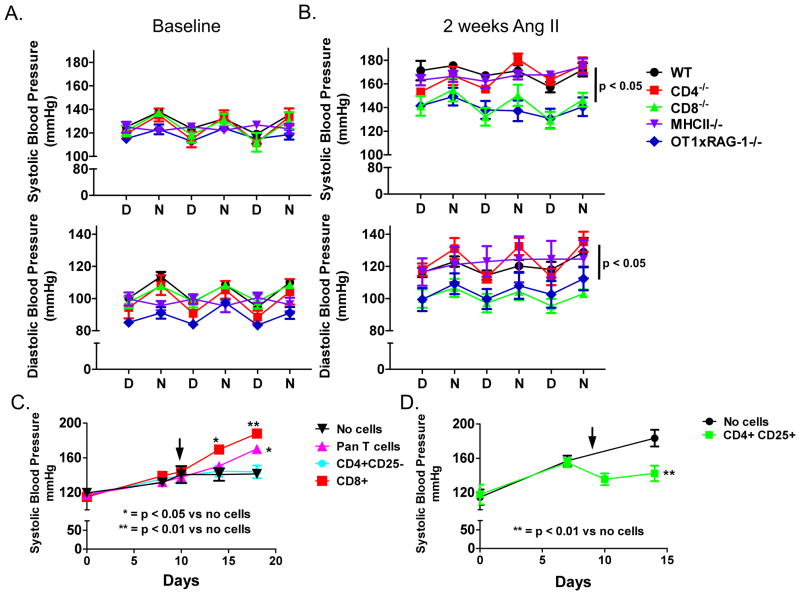
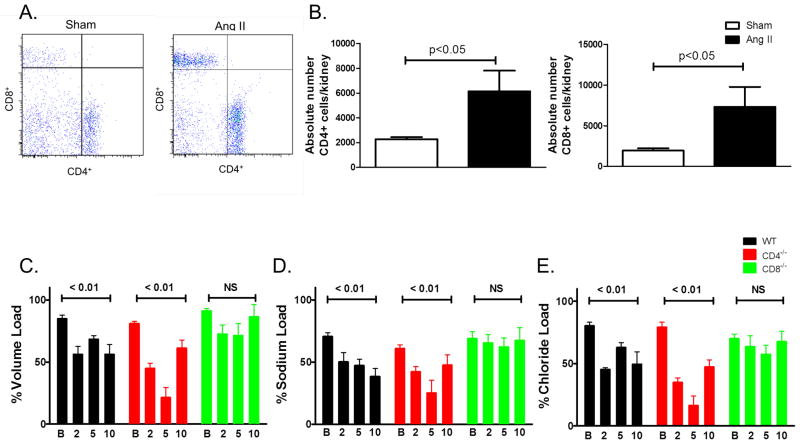
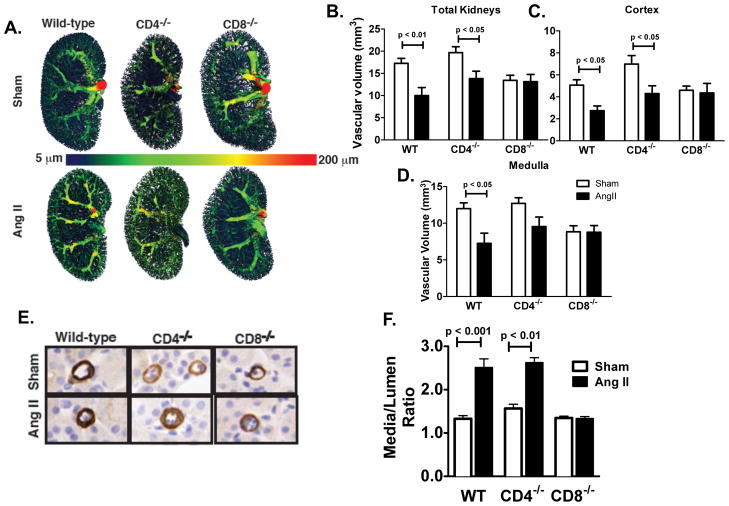
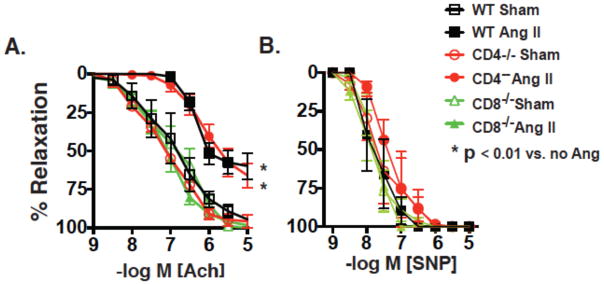
Recent studies have emphasized a role of adaptive immunity, and particularly T cells, in the genesis of hypertension. We sought to determine the T-cell subtypes that contribute to hypertension and renal inflammation in angiotensin II-induced hypertension. Using T-cell receptor spectratyping to examine T-cell receptor usage, we demonstrated that CD8(+) cells, but not CD4(+) cells, in the kidney exhibited altered T-cell receptor transcript lengths in Vβ3, 8.1, and 17 families in response to angiotensin II-induced hypertension. Clonality was not observed in other organs. The hypertension caused by angiotensin II in CD4(-/-) and MHCII(-/-) mice was similar to that observed in wild-type mice, whereas CD8(-/-) mice and OT1xRAG-1(-/-) mice, which have only 1 T-cell receptor, exhibited a blunted hypertensive response to angiotensin II. Adoptive transfer of pan T cells and CD8(+) T cells but not CD4(+)/CD25(-) cells conferred hypertension to RAG-1(-/-) mice. In contrast, transfer of CD4(+)/CD25(+) cells to wild-type mice receiving angiotensin II decreased blood pressure. Mice treated with angiotensin II exhibited increased numbers of kidney CD4(+) and CD8(+) T cells. In response to a sodium/volume challenge, wild-type and CD4(-/-) mice infused with angiotensin II retained water and sodium, whereas CD8(-/-) mice did not. CD8(-/-) mice were also protected against angiotensin-induced endothelial dysfunction and vascular remodeling in the kidney. These data suggest that in the development of hypertension, an oligoclonal population of CD8(+) cells accumulates in the kidney and likely contributes to hypertension by contributing to sodium and volume retention and vascular rarefaction.

Keywords: adaptive immunity; angiotensin II; diuresis; natriuresis; receptors, antigen, T-cell.


Conflict of interest statement

Conflict(s) of Interest/Disclosure(s) Statement: none

Figures

Figure 1
Figure 1
Sample TCR Vβ Family Spectratype Profiles from Spleen and Mesenteric Vasculature. Mice were made hypertensive by infusion of angiotensin II (Ang II, 490 ng/kg/min) for 14 days. CD4+ and CD8+ T cells were isolated from the spleen or mesentery, mRNA isolated and reverse transcribed to cDNA. PCR was performed using 24 different Vβ primers and a single FAM labeled Cβ primer. The resulting fragment profiles were visualized using Peak Scanner software from Applied Biosystems. A) Spleen sample distributions for each CD4+ Vβ family from sham and angiotensin II treated mice. B) Spleen sample distributions from CD8+ Vβ families. C) Mesentery sample distributions from CD4+ Vβ families. C) Mesentery sample distributions from CD8+ Vβ families. Vβ families not shown were undetectable.
Figure 2
Figure 2
TCR Vβ Family Spectratype Profiles from Kidney T cells. Samples were prepared from the kidneys of sham and angiotensin II (Ang II)-infused mice as described in figure 1. A) Kidney sample distributions for each CD4+ Vβ family from sham and angiotensin II treated mice. B) Kidney sample distributions from CD8+ Vβ families. Vβ families not shown were undetectable. TCR length profiles were analyzed using Applied Biosystems Peak Scanner software and the area under each peak at a given transcript length was divided by the total area under all peaks to determine the relative frequency of each individual transcript length. Frequency distributions are shown for CD8+ C) Vβ3, D) Vβ8.1 and E) Vβ17 families. Spectratyping profiles were p values determined by Dirichelet distribution and the MaGiK analysis, n = 8–10 per group.
Figure 3
Figure 3
Role of T cell subtypes in angiotensin II (Ang II)-induced hypertension. Wild-type (WT, n = 4), CD4−/− (n = 5), CD8−/− (n = 5), MHCII−/− (n = 6) and OT1xRAG-1−/− (n = 10) mice received angiotensin II (490 ng/kg/min) for 15 days via osmotic minipumps. Blood pressure was monitored by telemetry and values represent day/night averages for each group during the last 3 days of infusion. A) Baseline systolic (top) and diastolic blood pressures (bottom) B) 14 day systolic (top) and diastolic blood pressures (bottom). C) Adoptive transfer of T cells into RAG-1−/− mice. RAG-1−/− mice received angiotensin II (Ang II) via osmotic minipump starting at day 0 and at day 10 received no cells, pan T cells, CD4+/CD25 or CD8+ T cells from WT mice (n = 7–9 per group) that had previously received angiotensin II for 2 weeks. Blood pressure was measured by tail cuff. D) Adoptive transfer of CD4+/CD25+ into WT mice. Both groups received Ang II starting at day 0 and at day 9 received no cells or CD4+/CD25+ T cells from untreated WT mice. (n = 5 per group) P values for blood pressure were determined using repeated measures ANOVA and a Student Newman Keuls post-hoc test. D = day, N = night.
Figure 4
Figure 4
Renal T cells accumulation and their role in the anti-diuresis and anti-natriuresis caused by angiotensin II (Ang II). Kidney single cell suspensions from sham and Ang II treated mice were subjected to flow cytometry for analysis of CD4+ and CD8+ T cell accumulation. A) Sample flow cytometry plots and B) Absolute numbers of CD4+ and CD8+ cells per kidney. n = 6 per group p values determined by unpaired t test. C) urine, D) sodium and E) chloride output over 4 hours in response to 10% of mouse body weight in saline IP on the days indicated (n = 5–6 per group). P values represent changes from baseline determined by repeated measures ANOVA. B-Baseline 2-, 5-, 10-days of angiotensin II treatment.
Figure 5
Figure 5
Effect of T cell subtypes on the kidney vascular structure. A) Representative CT models of the kidney vasculature in sham and angiotensin II (Ang II) treated mice. Quantification of B) total vascular volume (mm2), C) cortex vascular volume, D) medulla vascular volume (n = 3–5 per group). E) alpha actin staining for renal cortical arterioles in wild-type (WT), CD4−/− and CD8−/− mice. F) Renal arterioles <25 mm in diameter and arteries > 25 mm were quantified by planimetry (n = 4 per group). P values determined by 2 way ANOVA.
Figure 6
Figure 6
Influence of T cell subtypes in angiotensin II-induced vascular dysfunction. Mice received sham or angiotensin II (Ang II) infusions for 2 weeks as in figure 1. Second and third order mesenteric vessels were mounted in wire myographs and pre-constricted with phenylephrine (1 μm). A) Endothelium-dependent relaxations to acetylcholine and B) endothelium-dependent independent relaxations to sodium nitroprusside (SNP) were then determined and compared using ANOVA for repeated measures (n = 4–7 per group).

Similar articles

Cited by

References

    1. Wolf-Maier K, Cooper RS, Banegas JR, Giampaoli S, Hense HW, Joffres M, Kastarinen M, Poulter N, Primatesta P, Rodriguez-Artalejo F, Stegmayr B, Thamm M, Tuomilehto J, Vanuzzo D, Vescio F. Hypertension prevalence and blood pressure levels in 6 European countries, Canada, and the United States. JAMA. 2003;289:2363–2369. - PubMed
    1. Kearney PM, Whelton M, Reynolds K, Muntner P, Whelton PK, He J. Global burden of hypertension: analysis of worldwide data. Lancet. 2005;365:217–223. - PubMed
    1. Guzik TJ, Hoch NE, Brown KA, McCann LA, Rahman A, Dikalov S, Goronzy J, Weyand C, Harrison DG. Role of the T cell in the genesis of angiotensin II induced hypertension and vascular dysfunction. J Exp Med. 2007;204:2449–2460. - PMC - PubMed
    1. Crowley SD, Song YS, Lin EE, Griffiths R, Kim HS, Ruiz P. Lymphocyte responses exacerbate angiotensin II-dependent hypertension. Am J Physiol Regul Integr Comp Physiol. 2010;298:R1089–1097. - PMC - PubMed
    1. Mattson DL, Lund H, Guo C, Rudemiller N, Geurts AM, Jacob H. Genetic mutation of recombination activating gene 1 in Dahl salt-sensitive rats attenuates hypertension and renal damage. Am J Physiol Regul Integr Comp Physiol. 2013;304:R407–414. - PMC - PubMed

Publication types

MeSH terms