. 2014 Sep 25;159(1):46-57.
doi: 10.1016/j.cell.2014.07.042.

Melatonin signaling controls circadian swimming behavior in marine zooplankton

Affiliations

Melatonin signaling controls circadian swimming behavior in marine zooplankton

Maria Antonietta Tosches et al. Cell. .

Abstract

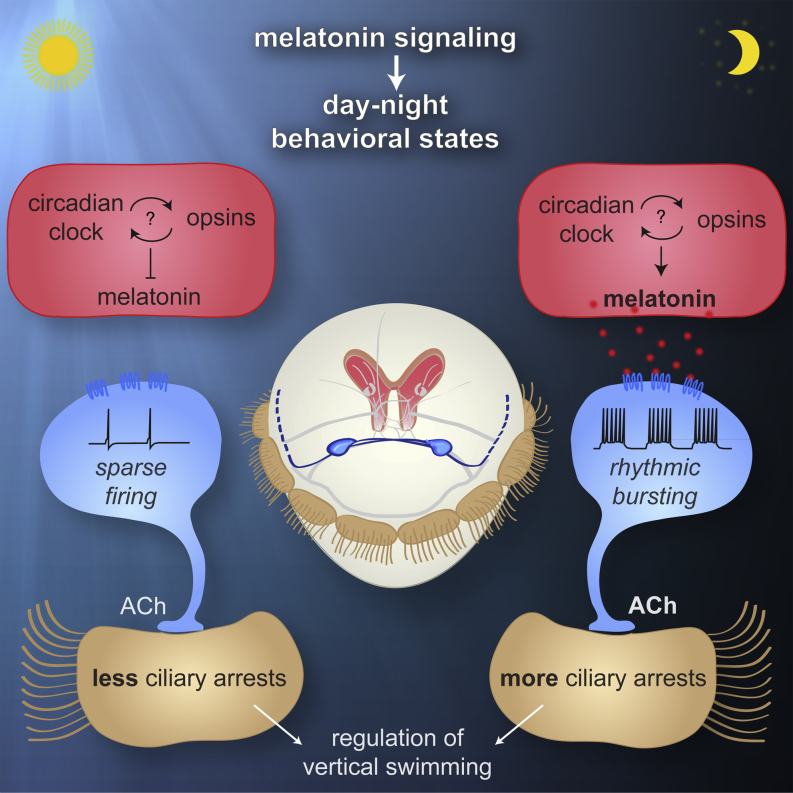
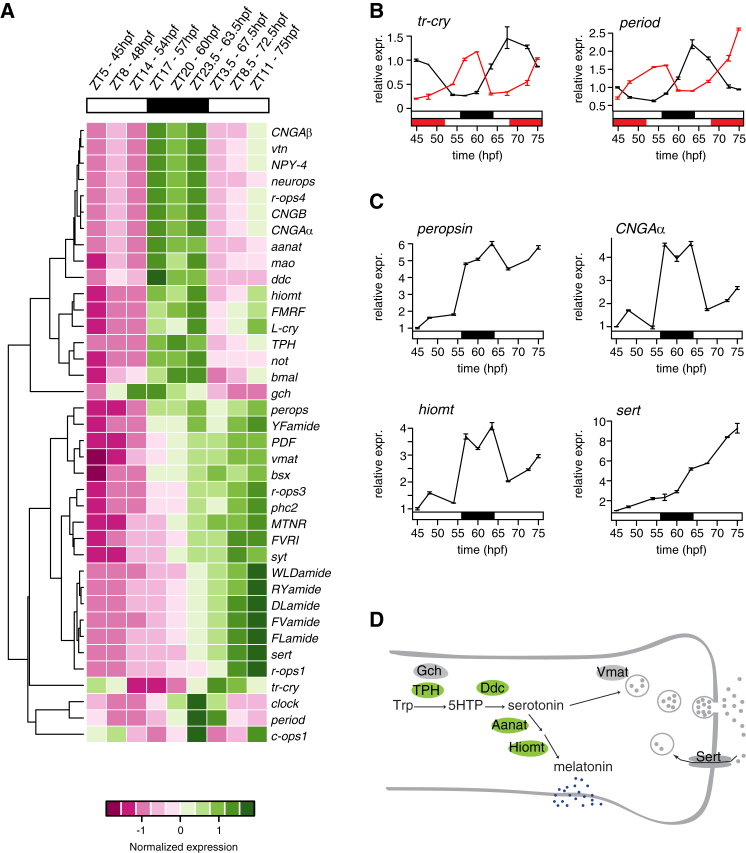
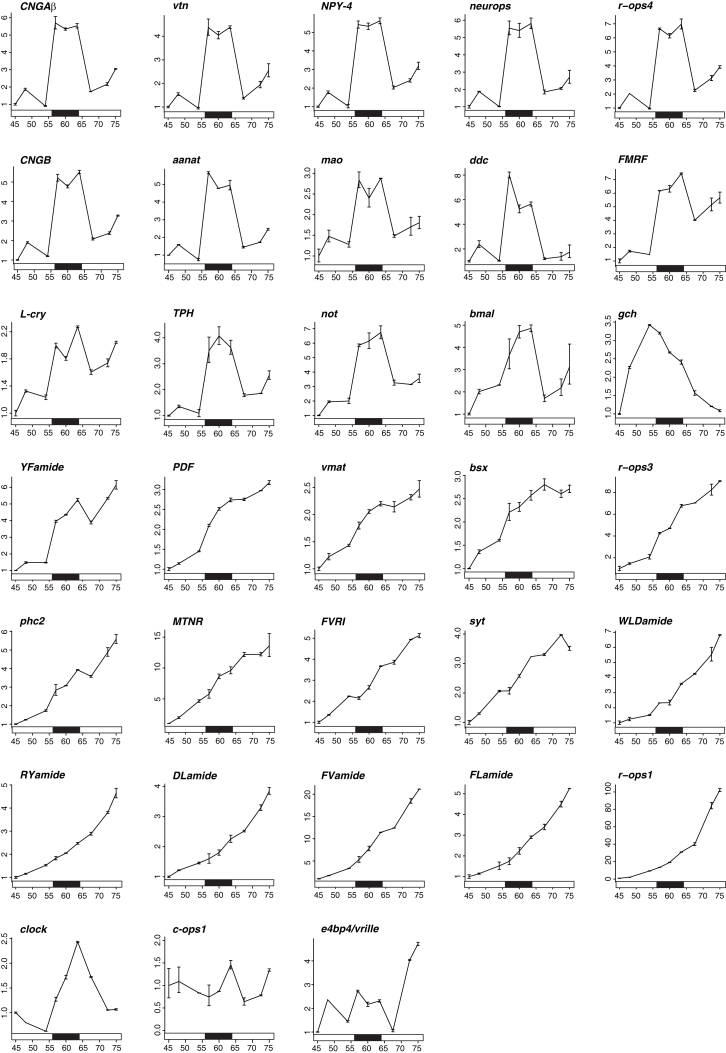
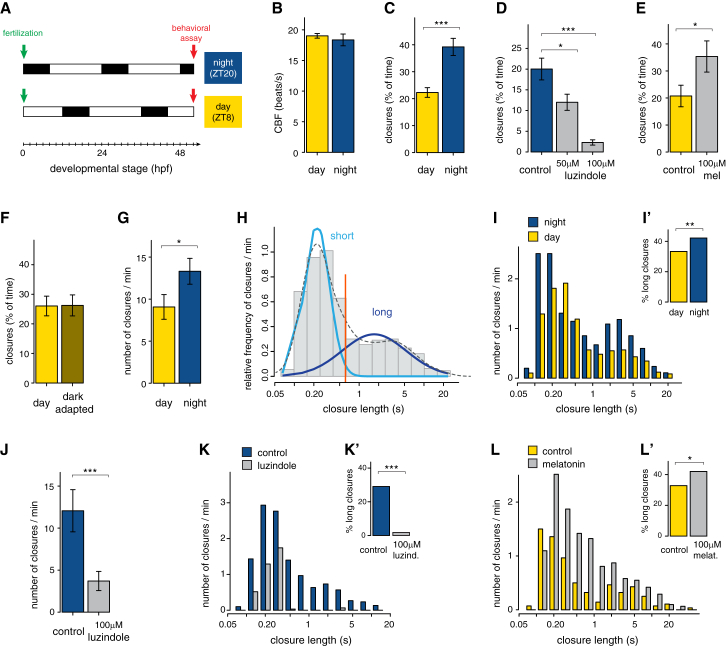
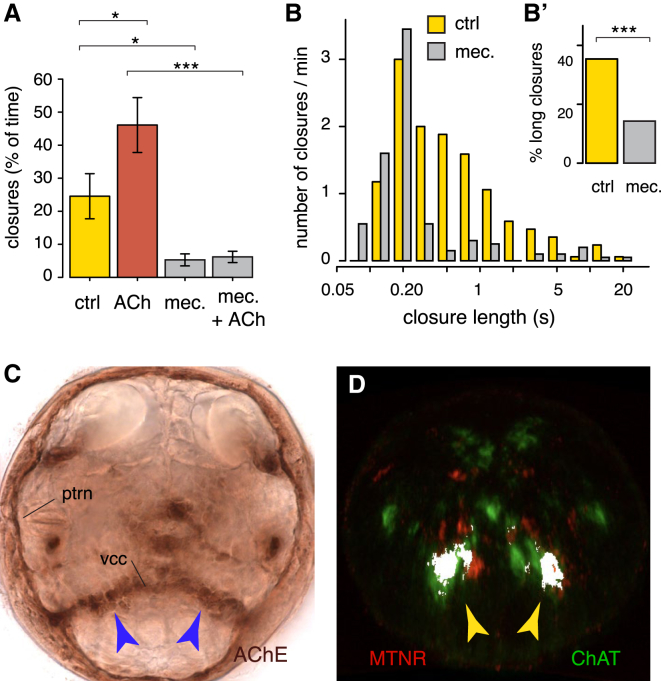
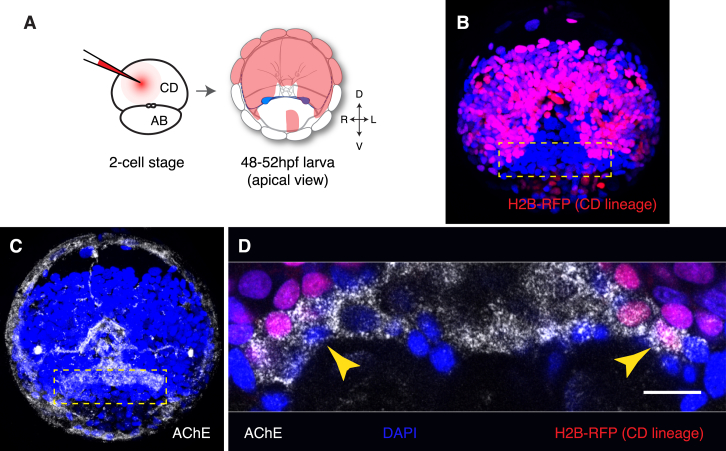
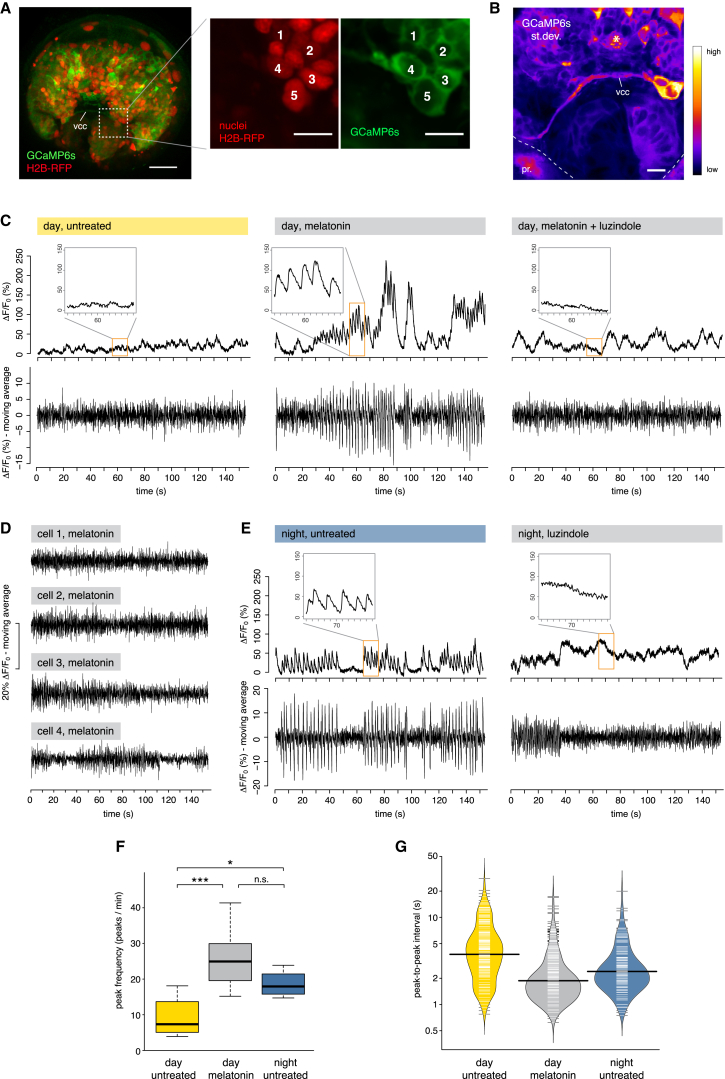
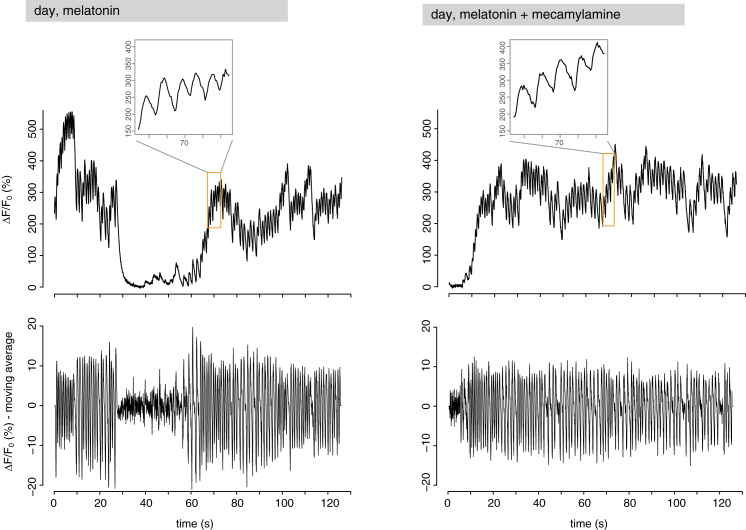
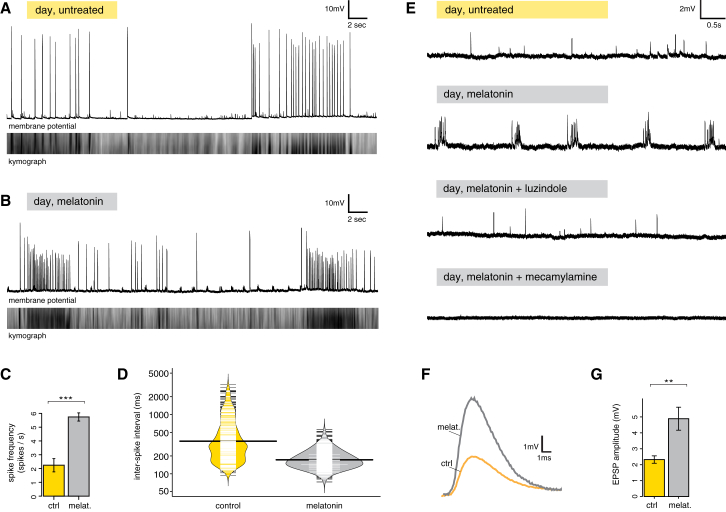
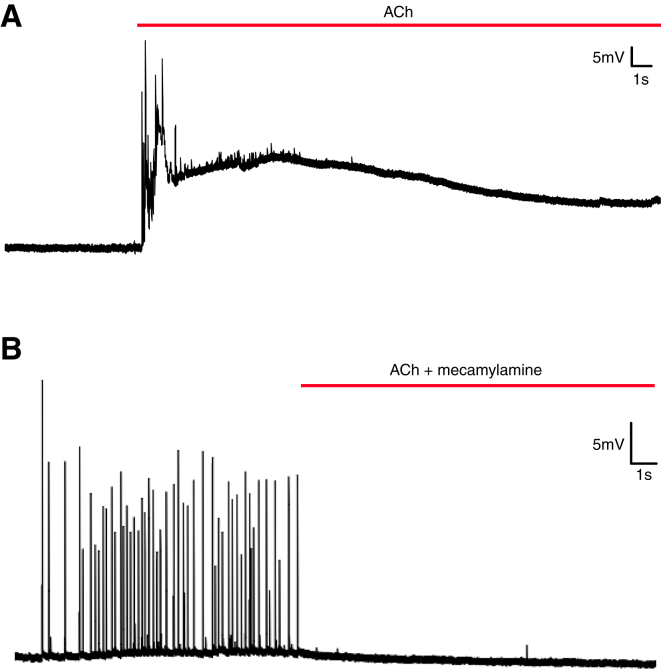
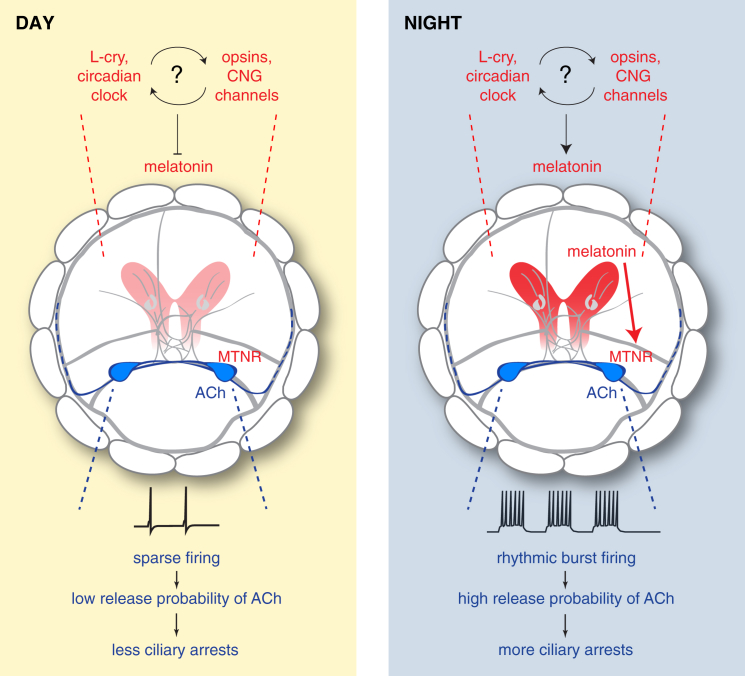
Melatonin, the "hormone of darkness," is a key regulator of vertebrate circadian physiology and behavior. Despite its ubiquitous presence in Metazoa, the function of melatonin signaling outside vertebrates is poorly understood. Here, we investigate the effect of melatonin signaling on circadian swimming behavior in a zooplankton model, the marine annelid Platynereis dumerilii. We find that melatonin is produced in brain photoreceptors with a vertebrate-type opsin-based phototransduction cascade and a light-entrained clock. Melatonin released at night induces rhythmic burst firing of cholinergic neurons that innervate locomotor-ciliated cells. This establishes a nocturnal behavioral state by modulating the length and the frequency of ciliary arrests. Based on our findings, we propose that melatonin signaling plays a role in the circadian control of ciliary swimming to adjust the vertical position of zooplankton in response to ambient light.


Figures

None
Graphical abstract
Figure S1
Figure S1
Phylogeny of hiomt Genes in Metazoa, Related to Figure 1 (A) Maximum likelihood phylogenetic tree of hiomt genes in Metazoa. Hiomt orthologs are present in Cnidaria (Anctil, 2009), in several annelids, in mollusks and in hemichordates. The accession numbers of the sequences used to build the tree (from NCBI, ENSEMBL, or JGI) are indicated in the figure. Numbers on the branches represent 100-times bootstrap support values. (B) Genomic structure of representative hiomt genes. The gray rectangles represent exons, the lines between them introns (introns are not in scale). The positions of conserved splice sites are indicated by the colored dots.
Figure 1
Figure 1
Coexpression of Opsins, Clock Genes, and hiomt in the Dorsal Larval Brain (A) SEM of a Platynereis trochophore larva, showing the position of the developing apical nervous system (episphere) and the prototroch (image courtesy of H. Hausen). (B) Z-projection of the brain axonal scaffold at 48 hpf, stained with an anti-acetylated tubulin antibody, apical view. Main landmarks are indicated. cPRCs, ciliary photoreceptor cells (yellow arrows); ptrn, prototroch ring nerve; vcc, ventral cerebral commissure. Scale bar, 20 μm. (C) Average gene coexpression at 48 hpf obtained with Profiling by Image Registration (PrImR). Blue, coexpression of hiomt, L-cry, CNGAα, and c-opsin1; magenta, coexpression of hiomt, L-cry, and CNGAα; gray, average axonal scaffold. (D–F) Expression of hiomt (D), CNGAα (E), and L-cry (F) at 34 hpf. All images are Z-projections of the entire episphere (apical views, dorsal up). Blue, DAPI; red, gene expression; gray, axonal scaffold. (G–K) Expression of hiomt (G), CNGAα (H), L-cry (I), peropsin (J), and CNGAβ (K) at 48 hpf. All images are 10 μm Z-projections of the extended cPRCs region (apical views, dorsal up). Red, gene expression; gray, axonal scaffold. Arrows, cilia of cPRCs; asterisks, apical organ. Scale bar, 10 μm. (L) Schematic representation of the larval brain; the region harboring expression of opsins, CNG-based phototransduction, clock genes, and melatonin synthesis markers is highlighted. See also Figures S1 and S2.
Figure S2
Figure S2
Additional Gene Expression Patterns in the Platynereis Dorsal Brain, Related to Figure 1 (A) Expression of the Giα subunit at 48hpf. Z-projection of a confocal stack, apical view. Red: gene expression; green: axonal scaffold; blue: DAPI. (B–E) Gene expression in the extended ciliary photoreceptors region (dashed lines, apical views). Expression of the phototransduction cyclic-nucleotide gated channels CNGAα (B) and CNGB (C) at 48hpf; the circadian marker vrille at 48hpf (D) and neuropsin at 72hpf (E). (F) Expression of MTNR in the developing brain at 48hpf. The arrowheads indicate the ventral cholinergic-MTNR+ neurons.
Figure 2
Figure 2
Global Changes of Gene Expression during the Light-Dark Cycle (A–D) Gene expression profiling of Platynereis larvae between 45 and 75 hpf with Fluidigm Dynamic Arrays. (A) Hierarchical clustering of scaled gene expression levels. Sampling stages and circadian times indicated at the top. High and low normalized expression levels are indicated with green and magenta, respectively. (B and C) Expression profiles from the Fluidigm screen. Gene expression levels are plotted as relative to the expression at 45 hpf. Each point is the average of the two technical replicates (see the Extended Experimental Procedures for details). Error bars indicate SD. (B) Expression of the clock genes tr-cry and period between 45 and 75 hpf. The red lines indicate relative expression in siblings raised under an inverted light-dark cycle (the red solid bars below indicate the night phase of the inverted cycle). (C) Examples of day-night gene expression dynamics. CNGAα and hiomt are upregulated at night; sert is developmentally regulated; and peropsin is both night upregulated and developmentally regulated. (D) Schematic of the serotonin-melatonin biosynthesis pathway. The genes significantly upregulated at night are shown in green. Hpf, hours post fertilization; ZT, zeitgeber time. See also Figure S3.
Figure S3
Figure S3
Gene Expression Dynamics during the Light-Dark Cycle, Related to Figure 2 The figure shows the gene expression profiles, relative to the first time point (45hpf), of genes assayed with the Fluidigm Dynamic Arrays. The same data set was used for clustering analysis in Figure 2. Here, gene expression relative to the first time point is plotted on the y axis, and developmental time (hpf = hours post fertilization) is plotted on the x axis. Each point represents the average of the two technical replicates (PreAmps), and error bars indicate standard deviation. The black bar below each plot indicates the night phase (from 56hpf to 64hpf).
Figure 3
Figure 3
Melatonin Signaling Modulates Nocturnal Locomotor Activity (A) Design of the behavioral experiments. Larvae were assayed for locomotor activity at 52 hpf (red arrows), corresponding to ZT8 (midday) or ZT20 (midnight). (B) Ciliary beating frequency (CBF; beats/s) during day and night. n = 59 and 25 larvae. p = 0.44, unpaired t test. (C) Ciliary closure time (% of total time) during day and night. p < 0.001, unpaired t test. n = 72 and 55 larvae. (D) Ciliary closure time (% of total time) at night, in larvae treated with 50 or 100 μM of the melatonin receptor antagonist luzindole in DMSO (gray). Control = 0.1% DMSO (blue). p < 0.05 and p < 0.001, unpaired t test. n = 30, 12, and 16 larvae. (E) Ciliary closure time (% of total time) during daytime; larvae were treated with 100 μM of melatonin in NSW (gray). Control = NSW (yellow). p < 0,05, unpaired t test. n = 28 and 31 larvae. (F) Ciliary closure time (% of total time) at ZT8; larvae were imaged under normal daylight or in complete darkness after 1 hr of dark adaptation. n = 27 and 23 larvae. (G) Frequency of ciliary arrests (number of closures/min) during day and night. n = 58 and 55 larvae, respectively. p < 0.05, unpaired t test. (H) Probability density plot of ciliary closure lengths (on the logarithmic scale) during daytime, showing a bimodal distribution with distinct long and short arrests. (I) Normalized distribution of ciliary closure lengths during day (yellow) and night (blue). n = 58 and 55 larvae. (I′) Percentage of long ciliary arrests during day and night; data are from (I). Long arrests are 33% and 42% of total arrests, respectively. p < 0.01, chi-square test. (J) Frequency of ciliary arrests (number of closures/min) in controls (0.1% DMSO, blue) and in larvae treated with 100 μM luzindole (gray) during the night. n = 30 and 31 larvae. p < 0.001, unpaired t test. (K) Normalized distribution of ciliary closure lengths in controls (0.1% DMSO, blue) and in larvae treated with 100 μM luzindole (gray). n = 30 and 31 larvae. (K′) Percentage of long ciliary arrests in controls (0.1% DMSO) and in larvae treated with 100 μM luzindole at night; data are from (K). Long closures are 29% and 2% of total, respectively. p < 0.001, chi-square test. (L) Normalized distribution of ciliary closure lengths in controls (NSW, yellow) and in larvae treated with 100 μM melatonin (gray). n = 24 and 23 larvae. (L’) Percentage of long ciliary arrests in controls and in larvae treated with 100 μM melatonin during the day; data are from (L). Long closures are 33% and 42% of total, respectively. p < 0.05, chi-square test. In (B)–(G) and (J), data are shown as mean ± SEM, and error bars indicate SEM. NSW, natural seawater.
Figure 4
Figure 4
Ciliary Arrests Are Triggered by Cholinergic Transmission (A) Ciliary closure time (% of total time) during daytime, in controls (NSW, yellow), and in larvae treated with 1 μM ACh (red), with 1 μM of the cholinergic antagonist mecamylamine or with a mixture of 1 μM of mecamylamine and 1 μM ACh (gray). One-way ANOVA with post hoc Holm adjustment, p < 0.05, ∗∗∗p < 0.001. n = 15, 19, 22, and 17 larvae, respectively. Error bars represent SEM. (B) Normalized distribution of ciliary closure lengths in controls (0.95% EtOH, yellow) and in larvae treated with 100 μM mecamylamine (gray). n = 17 and 20 larvae. (B′) Percentage of long closures in controls (0.95% EtOH) and in larvae treated with 100 μM mecamylamine during the day; data are from (B). Long closures are 35% and 14% of total, respectively. p < 0.001, chi-square test. (C) Acetylcholinesterase (AChE) staining of a 52 hpf Platynereis trochophore larva (apical view), showing signal in the prototroch ring nerve (ptrn). The blue arrowheads indicate the ventral brain cholinergic neurons and projections to the ptrn through the ventral cerebral commissure (vcc). (D) Coexpression (white) of melatonin receptor (MTNR, red; see also Figure S2) and the cholinergic marker ChAT (green) in the 48 hpf larval brain, after image registration. Arrowheads, ventral brain cholinergic neurons.
Figure S4
Figure S4
Position of the Ventral Cholinergic Neurons in Relationship to the Clonal Domains of the Larval Brain, Related to Figure 5 (A) Diagram showing the AB and CD blastomeres at 2-cell stage and the clonal domain of the episphere developing from the CD blastomere in 2-days old larvae (cfr. Ackermann et al., 2005 and Wilson, 1892). (B) Distribution of H2B-RFP after injection of the CD blastomere with H2B-RFP mRNA, showing that the dorsal part of the larval brain develops from the CD blastomere (Z-projection of a confocal stack through the entire developing brain, apical view). Red: H2B-RFP, labeling the nuclei of the CD lineage; blue: DAPI. (C) The same larva as in A, after acetylcholinesterase (AChE) staining (white, confocal reflection microscopy). (D) Magnification of the larva in (B) and (C), showing the relationship of the AChE staining with the CD lineage. The arrowheads indicate two corresponding neurons, on the right and left side, which develop in stereotypic positions from AB and CD, respectively. Injection of the CD blastomere thus allows selective labeling of the neuron on the left side of the larva, but not of the corresponding one on the right. This same neuron is unique in its projection to the prototroch through the ventral cerebral commissure (compare Figure 5B and Lacalli, 1984). Scale bar = 10 μm.
Figure 5
Figure 5
Melatonin-Dependent Rhythmic Activity in Ventral Cholinergic Neurons (A) Left: expression of GCaMP6s (green) and H2B-RFP (red) in the brain of larvae injected with GCaMP6s and H2B-RFP mRNAs at two-cell stage (Z-projection of the episphere, apical view). Scale bar, 30 μm. Middle and right: magnification of the most ventral cells of the CD lineage labeled by GCaMP6s and H2B-RFP. These cells correspond to ventral brain cholinergic neurons (compare Figure S4). Scale bar, 10 μm. (B) SD of GCaMP6s fluorescence (apicoventral view) after melatonin treatment in a 2-min-long recording, showing that the most ventral neuron of the CD domain (compare cell number 5 in A) responds to melatonin with dynamic activity (high SD) and projects to the prototroch (pr, dashed line) through the ventral cerebral commissure (vcc). Scale bar, 10 μm. (C) GCaMP6s fluorescence of a representative prototroch-projecting cholinergic neuron (cell number 5 in A) during daytime, in control conditions (left), after treatment with 100 μM melatonin (middle), and after subsequent addition of 100 μM of the melatonin receptor antagonist luzindole (right). Upper row: GCaMP6s signal normalized with a global F0; lower row: GCaMP6s signal normalized with a local F0 (moving average over a window of 0.8 s), to highlight changes in fluorescence over a small timescale (see the Experimental Procedures for details on the analysis). (D) GCaMP6s fluorescence of the cells 1–4 (A) after treatment with melatonin. Data normalized with the moving average approach. (E) GCaMP6s fluorescence of a representative prototroch-projecting cholinergic neuron at night, in control conditions (left), and after treatment with 100 μM luzindole (right). (F) Frequency of GCaMP6s peaks (number of peaks/min) in untreated larvae during daytime (yellow), after melatonin treatment during daytime (gray), and in untreated larvae during the night (blue). n = 10, 8, and 4 larvae, respectively. One-way ANOVA with post hoc Holm adjustment, p < 0.05, ∗∗∗p < 0.001. (G) Bean plot showing the distribution (on the logarithmic scale) of the peak-to-peak intervals (s) in untreated larvae during daytime (yellow), after melatonin treatment during daytime (gray), and in untreated larvae at night (blue). Thin white lines indicate single data points; black horizontal lines indicate means. n = 10, 8, and 4 larvae, respectively. See also Figures S4 and S5 and Movie S1.
Figure S5
Figure S5
The Cholinergic Antagonist Mecamylamine Does Not Affect the Activity of Ventral Ciliomotor Neurons in Melatonin-Treated Larvae, Related to Figure 5 GCaMP6s fluorescence of a representative prototroch-projecting cholinergic neuron during daytime, after treatment with 100 μm melatonin (left) and subsequent addition of the acetylcholine receptor antagonist mecamylamine (100 μm, right). Upper row: GCaMP6s signal normalized with a global F0; lower row: GCaMP6s signal normalized with a local F0 (corresponding to the moving average over a window of 0.8 s), to highlight changes in fluorescence over a small time scale (see Experimental Procedures for details on the analysis).
Figure 6
Figure 6
Melatonin Induces Rhythmic Bursting of Cholinergic Prototroch Presynaptic Neurons and an Enhanced Release of ACh (A) Intracellular recording from a prototroch cell during daytime (top), and kymograph of ciliary beating imaged simultaneously (bottom; black bars: ciliary arrests), showing the correlation of prototroch spikes with ciliary arrests (100 μM). (B) Same as (A), in a melatonin-treated larva (100 μM). (C) Average prototroch spike frequency in controls (NSW) and in melatonin-treated larvae. p < 0.001, n = 7 larvae each. Error bars, SEM. (D) Bean plot showing the distribution (on the logarithmic scale) of interspike intervals (ms) in controls (NSW, yellow) and in melatonin-treated larvae (100 μM, gray). Thin white lines indicate single data points; black horizontal lines indicate means. n = 7 larvae each. (E) EPSPs recorded from prototroch cells. Traces (from top to bottom) represent EPSPs in untreated larvae and EPSPs after treatment with melatonin (100 μM), melatonin plus subsequent addition of luzindole (100 μM), and melatonin plus subsequent addition of mecamylamine (100 μM). (F) Average EPSP responses measured from prototroch cells in absence (yellow) and the presence of melatonin (gray). n = 7 larvae. (G) Average EPSPs amplitude (mV) in controls (yellow) and melatonin-treated larvae (gray). n = 7 larvae, p < 0.01, paired t test. Error bars, SEM. See also Figure S6.
Figure S6
Figure S6
Effects of ACh and of the Cholinergic Antagonist Mecamylamine on the Prototroch Cells Electrical Activity, Related to Figure 6 (A) Representative intracellular recording from a prototroch cell where acetylcholine is applied (red line, ACh, 10mM) coincident with a phase of decreased activity. Acetylcholine elicits prototroch spiking and a depolarization of the postsynaptic prototroch cell. (B) Representative intracellular recording from a prototroch cell after simultaneous application of acetylcholine and mecamylamine (red line, 10mM and 250 μM) during a phase of high activity. Mecamylamine suppresses synaptic activity and thereby the endogenous activity that would normally be evoked by acetylcholine.
Figure 7
Figure 7
Day-Night Modulation of Platynereis Ciliary Swimming by Melatonin Signaling In the extended ciliary photoreceptor region (red), the circadian clock and various opsins with a CNG-based phototransduction cascade regulate rhythmic release of melatonin. During the day (left), ventral cholinergic ciliomotor neurons (blue) fire sporadically and arrhythmically. Basal acetylcholine release at the ciliomotor-prototroch synapses ensures a low frequency and duration of ciliary arrests. At night (right), high melatonin levels directly affect the electrical activity of the cholinergic ciliomotor neurons, which express the melatonin receptor (MTNR). Therefore, the cholinergic neurons switch to a rhythmic bursting mode, which boosts the release of acetylcholine at the ciliomotor-prototroch synapses (i.e., increase of EPSPs amplitude). This increases the frequency of spiking in prototroch cells, causing longer and more frequent ciliary arrests.

Comment in

References

    1. Allada R., Siegel J.M. Unearthing the phylogenetic roots of sleep. Curr. Biol. 2008;18:R670–R679. - PMC - PubMed
    1. Alldredge A.L., King J.M. Effects of moonlight on the vertical migration patterns of demersal zooplankton. J. Exp. Mar. Biol. Ecol. 1980;44:133–156.
    1. Anctil M., Pani A.K., Ali M.A. Modulation of rhythmic contractions by melatonin via cyclic GMP in the coelenterate Renilla koellikeri. J. Comp. Physiol. B. 1991;161:569–575.
    1. Arendt D., Tessmar-Raible K., Snyman H., Dorresteijn A.W., Wittbrodt J. Ciliary photoreceptors with a vertebrate-type opsin in an invertebrate brain. Science. 2004;306:869–871. - PubMed
    1. Balzer I., Hardeland R. Photoperiodism and effects of indoleamines in a unicellular alga, Gonyaulax polyedra. Science. 1991;253:795–797. - PubMed

Supplemental References

    1. Ackermann C., Dorresteijn A., Fischer A. Clonal domains in postlarval Platynereis dumerilii (Annelida: Polychaeta) J. Morphol. 2005;266:258–280. - PubMed
    1. Anctil M. Chemical transmission in the sea anemone Nematostella vectensis: A genomic perspective. Comp. Biochem. Physiol. Part D Genomics Proteomics. 2009;4:268–289. - PubMed
    1. Arendt D., Technau U., Wittbrodt J. Evolution of the bilaterian larval foregut. Nature. 2001;409:81–85. - PubMed
    1. Asadulina A., Panzera A., Verasztó C., Liebig C., Jékely G. Whole-body gene expression pattern registration in Platynereis larvae. Evodevo. 2012;3:27. - PMC - PubMed
    1. Castresana J. Selection of conserved blocks from multiple alignments for their use in phylogenetic analysis. Mol. Biol. Evol. 2000;17:540–552. - PubMed

Publication types

Associated data