. 2014 Sep 25;159(1):200-214.
doi: 10.1016/j.cell.2014.09.002.

A drosophila genetic resource of mutants to study mechanisms underlying human genetic diseases

Affiliations

A drosophila genetic resource of mutants to study mechanisms underlying human genetic diseases

Shinya Yamamoto et al. Cell. .

Abstract

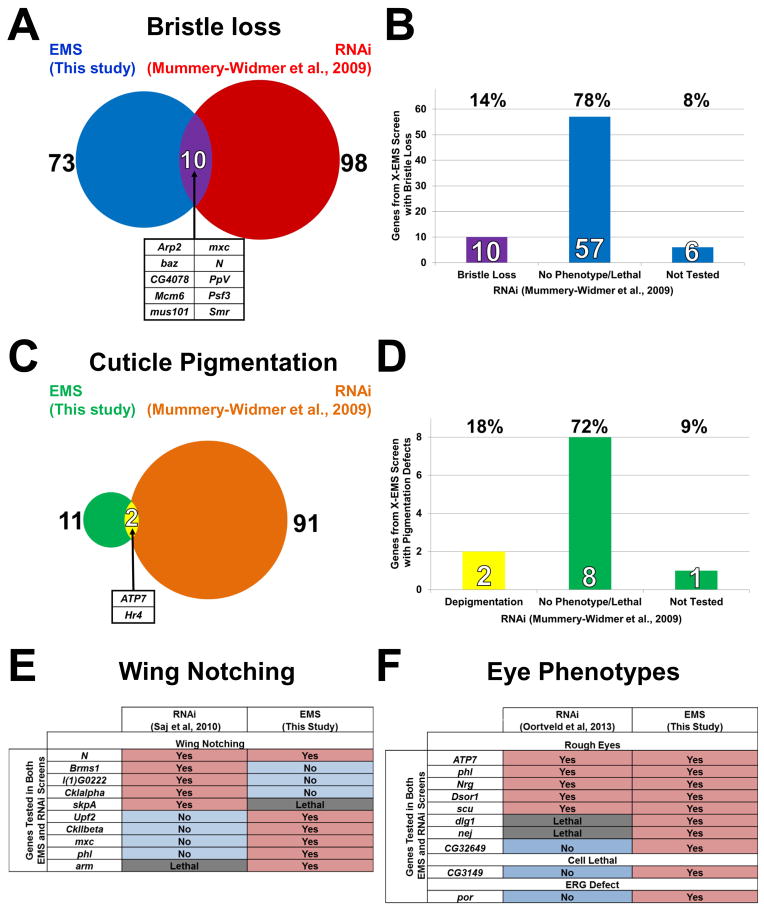
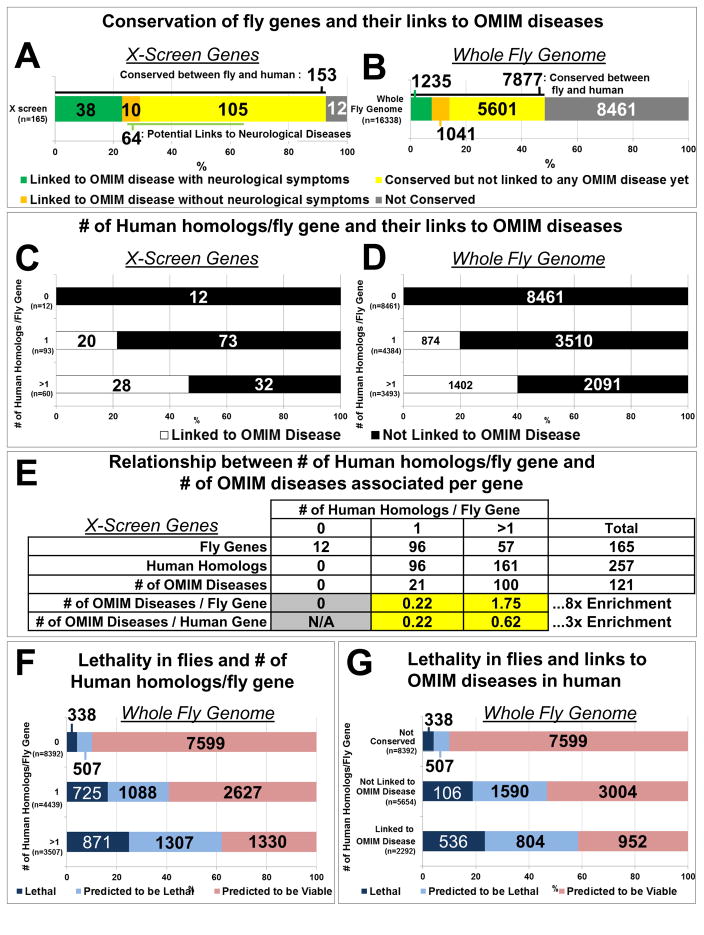
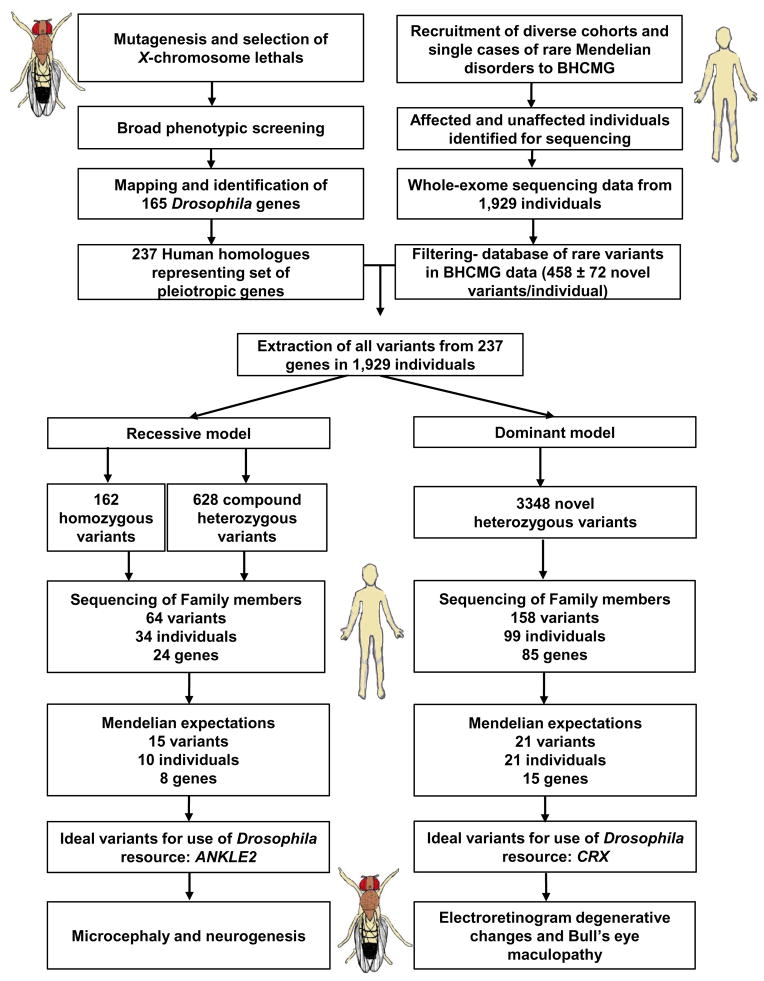
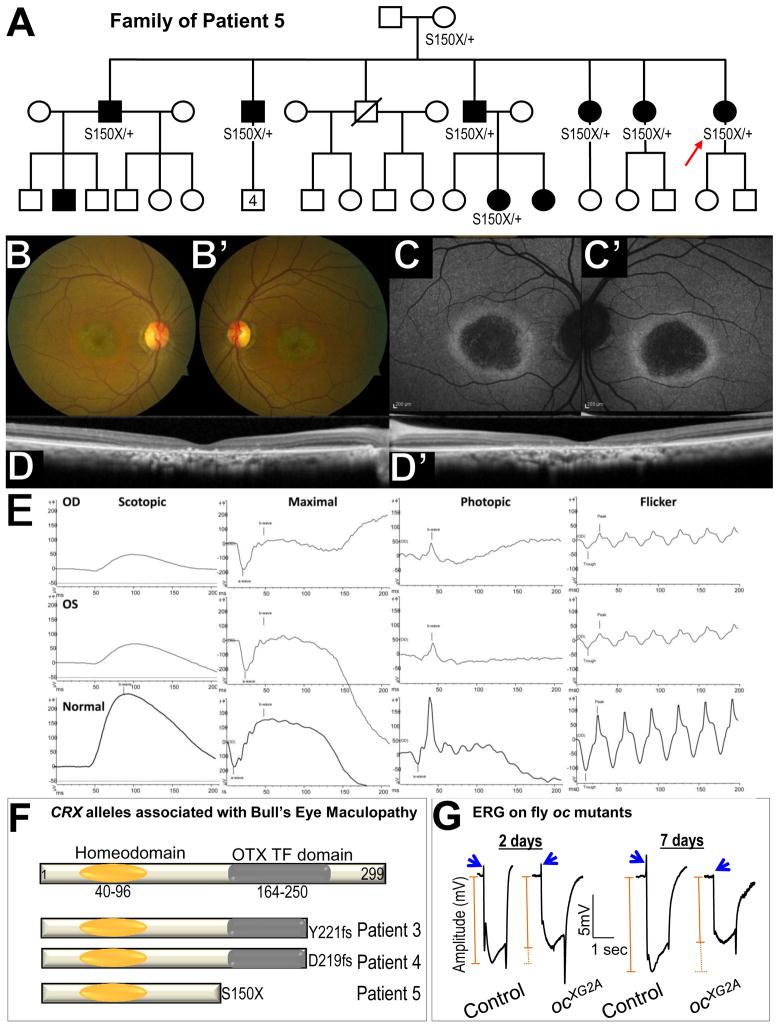
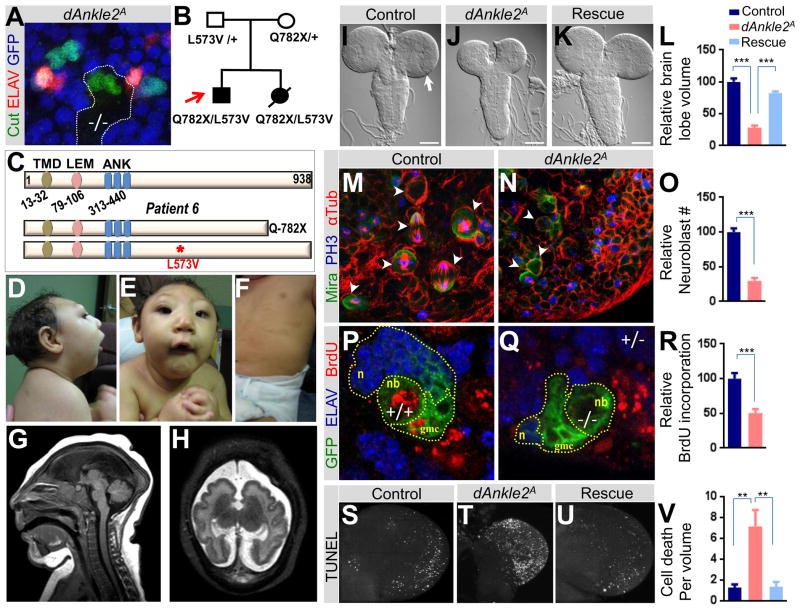
Invertebrate model systems are powerful tools for studying human disease owing to their genetic tractability and ease of screening. We conducted a mosaic genetic screen of lethal mutations on the Drosophila X chromosome to identify genes required for the development, function, and maintenance of the nervous system. We identified 165 genes, most of whose function has not been studied in vivo. In parallel, we investigated rare variant alleles in 1,929 human exomes from families with unsolved Mendelian disease. Genes that are essential in flies and have multiple human homologs were found to be likely to be associated with human diseases. Merging the human data sets with the fly genes allowed us to identify disease-associated mutations in six families and to provide insights into microcephaly associated with brain dysgenesis. This bidirectional synergism between fly genetics and human genomics facilitates the functional annotation of evolutionarily conserved genes involved in human health.


Figures

Figure 1
Figure 1. Summary of the Drosophila X-chromosome screen
(A) Pie chart and (B) bar graph of phenotypes scored in the screen. The numbers represent mutations in each phenotypic category. Note that one strain may show more than one phenotype in (B). (C–D) Examples of phenotypes observed in the notum. Homozygous wild-type bristles are marked by singed. Homozygous mutant bristles are marked by yellow (encircled by dotted line). Heterozygous bristles are wild-type for these two markers. (C) Wild-type. (D) Bristle [large bristles (macrochaetae) and small bristles (microchaetae)] loss. (E–I) Examples of ERG traces from mutant clones in the eye. A typical ERG has an on-transient (blue arrows), depolarization (orange line), and an off-transient (blue arrow head). ERGs were recorded in young (1–3 day old) and old (3–4 weeks old) flies for each genotype. (E) ERG of young or aged flies that show no obvious difference. (F) ERGs showing amplitude reduction in aged flies. (G) ERGs showing amplitude and on- and off-transient reduction in both young and aged mutants. (H) ERGs showing no or very small on-transient in both young and aged flies. (I) ERGs showing on- and off-transients that are either absent or very small in aged flies carrying mutant clones in eye. (J–M) Ultrastructural analysis using transmission electron microscopy (TEM) on young (two days old) and aged (three weeks old) mosaic flies. Red arrowheads indicate the rhabdomeres. (J) Young wild-type control eye: regular array of ommatidial structures with seven rhabdomeres surrounded by pigment (glia) cells. (K) Young mutant rhabdomeres showing intact structures. (L) Aged control eye tissue with intact rhabdomeres. (M) Aged mutant eye tissue with a strong degeneration of rhabdomeres. See also Figures S1, S2, S3.
Figure 2
Figure 2. Comparison of results from this EMS screen and previous RNAi screens
(A) Venn diagram and (B) bar graph showing overlap between two screens for bristle loss defects. The genes that were identified in the EMS screen were also screened by RNAi (Mummery-Widmer et al., 2009) and 10 caused a bristle loss whereas 57 showed no phenotype or caused lethality. (C) Venn diagram and (D) bar graph showing overlap between two screens for pigmentation defects (this screen and the RNAi screen of Mummery-Widmer). (E) Comparison of the results of these screens for wing notching defects. (F) Comparison of the results of these two screens for eye morphological defects.
Figure 3
Figure 3. Essential fly genes associated with more than one human homolog are more likely to be linked to human diseases
(A) Classification of genes identified in the screen based on human homologs and associated diseases. (B) Classification of the whole fly genome according to the same criteria as in (A). (C–D) Relationship between the number of human homologs per fly gene and their association with human diseases for genes identified in the screen (C) and the whole fly genome (D). (E) The number of human homologs per fly gene and their enrichment in OMIM associated human diseases. (F) Relationship between the number of human homologs per fly gene and lethality in flies. (G) Relationship between genes associated with lethality in flies and OMIM associated human diseases. See also Table S2.
Figure 4
Figure 4. Flowchart for discovery and functional studies of disease genes using the Drosophila resource and human exome data
See also Table S3, Figure S4.
Figure 5
Figure 5. Mutations in CRX cause bull’s eye maculopathy
(A) Pedigree of the family of Patient 5 (red arrow) with multiple individuals with bull’s eye maculopathy. The S150X mutation in CRX was identified in 7 patients. (B–D) Clinical phenotypes of Patient 5. (B–B′) Fundus photography show fine granularity in the outer retina and speckled glistening deposits arranged in a ring around the macula. Peripheral fundi appear unaffected. (C–C′) Autofluorescence images reveal a bull’s eye phenotype with hypo-fluorescent macula surrounded by a hyper-autofluorescent ring, suggesting a continuously atrophic macular area. (D–D′) Optical coherence tomography shows central loss of the outer nuclear layer, ellipsoid line, external limiting membrane, and retinal pigment epithelium atrophy corresponding to area of hypo-autofluorescence in (C–C′). (E) ERG of the proband: Electroretinographic traces showed implicit time delay and amplitude reduction in both scotopic and especially photopic responses in keeping with generalized cone-rod dysfunction. (F) Structure of CRX protein and mutations in Patients 3–5. (G) ERG of control and oc mutant clone in 2 days and 7 day (in light) old adult flies. Blue arrows indicate on transient in ERG. On-transients are lost in 7 days old flies. The orange line indicates the amplitude of ERG.
Figure 6
Figure 6. ANKLE2 and microcephaly
(A) dAnkle2 mutant clone of the peripheral nervous system in the thorax of a fly. In wild-type tissue (GFP, shown in blue), sensory organs are comprised of four cells marked by Cut (green), one of which is a neuron marked by ELAV (red). In the mutant clone (−/−, non-blue), the number of cells per sensory organ is reduced to two and does not contain a differentiated neuron. (B) Pedigree of the family of Patient 6 (red arrow) with a severe microcephaly phenotype. Both affected individuals inherited variants from both parents in ANKLE2. (C) Structure of ANKLE2 protein and mutations in Patient 6. Abbreviations: transmembrane domain (TMD), LAP2/emerin/MAN1 domain (LEM), ankyrin repeats (ANK). (D–E) Clinical phenotypes of the proband with a severe sloping forehead, microcephaly, and micrognathia. (F) Scattered hyperpigmented macules on the trunk. (G) Sagittal brain MRI of the proband in infancy with severe microcephaly, agenesis of the corpus callosum, and a collapsed skull with scalp ruggae. (H) Axial brain MRI showing polymicrogyria-like cortical brain malformations. (I–L) Third instar larval brain of (I) control (y w FRT19Aiso), scale bar indicates 100 microns (J) dAnkle2 mutant, and (K) dAnkle2 mutant in which the human ANKLE2 cDNA is ubiquitous expressed (Rescue). Note that brain lobe (arrow in I) size is reduced in dAnkle2 mutant (J) and the phenotype is rescued by ANKLE2 expression (K). Relative brain lobe volume of control, dAnkle2 and rescue using 3D confocal images is quantified in (L). (M–O) Larval CNS neuroblasts (arrowheads) in control and dAnkle2 mutant. Neuroblasts are marked by Miranda (Mira, green), chromosomes in dividing cells are marked by Phospo-Histone3 (PH3, blue), and spindles in dividing cells are marked by α-Tubulin (αTub, red). Relative number of neuroblasts in control and dAnkle2 is shown in (O). (P–R) BrdU incorporation (red) in control (P) and dAnkle2 mutant clones (Q) marked by GFP (green, dotted lines) in larval brains. Differentiated neurons are marked by ELAV (blue). Neuroblast (nb), ganglion mother cells (gmc), and neurons (n) are marked. Quantification of relative BrdU incorporation is shown in (R). (S–V) TUNEL assay in third instar larval brain lobes of (S) control, (T) dAnkle2 mutant, and (U) Rescue. Quantification of TUNEL positive cells/volume (cell death) is shown in (V). In Figures L, O, R and V, *** indicates a p-value < 0.001 and ** indicates a p-value < 0.01. See also Table S4, Figure S5.

Comment in

References

    1. Asencio C, Davidson IF, Santarella-Mellwig R, Ly-Hartig TB, Mall M, Wallenfang MR, Mattaj IW, Gorjanacz M. Coordination of kinase and phosphatase activities by Lem4 enables nuclear envelope reassembly during mitosis. Cell. 2012;150:122–135. - PubMed
    1. Bainbridge MN, Wiszniewski W, Murdock DR, Friedman J, Gonzaga-Jauregui C, Newsham I, Reid JG, Fink JK, Morgan MB, Gingras MC, et al. Whole-genome sequencing for optimized patient management. Sci Transl Med. 2011;3:87re83. - PMC - PubMed
    1. Bamshad MJ, Shendure JA, Valle D, Hamosh A, Lupski JR, Gibbs RA, Boerwinkle E, Lifton RP, Gerstein M, Gunel M, et al. The Centers for Mendelian Genomics: a new large-scale initiative to identify the genes underlying rare Mendelian conditions. Am J Med Genet A. 2012;158A:1523–1525. - PMC - PubMed
    1. Bayat V, Thiffault I, Jaiswal M, Tetreault M, Donti T, Sasarman F, Bernard G, Demers-Lamarche J, Dicaire MJ, Mathieu J, et al. Mutations in the mitochondrial methionyl-tRNA synthetase cause a neurodegenerative phenotype in flies and a recessive ataxia (ARSAL) in humans. PLoS Biol. 2012;10:e1001288. - PMC - PubMed
    1. Bellen HJ, Tong C, Tsuda H. 100 years of Drosophila research and its impact on vertebrate neuroscience: a history lesson for the future. Nat Rev Neurosci. 2010;11:514–522. - PMC - PubMed

Publication types