. 2014 Dec;122(12):1299-305.
doi: 10.1289/ehp.1307943. Epub 2014 Sep 26.

Modeled PFOA exposure and coronary artery disease, hypertension, and high cholesterol in community and worker cohorts

Affiliations

Modeled PFOA exposure and coronary artery disease, hypertension, and high cholesterol in community and worker cohorts

Andrea Winquist et al. Environ Health Perspect. 2014 Dec.

Abstract

Background: Several previous studies, mostly cross-sectional, have found associations between perfluorooctanoic acid (PFOA) and high cholesterol levels, but studies of hypertension and heart disease have had inconsistent findings.

Objectives: In this study we examined the association between modeled PFOA exposure and incident hypertension, hypercholesterolemia, and coronary artery disease among workers at a Mid-Ohio Valley chemical plant that used PFOA, and residents of the surrounding community.

Methods: Community- and worker-cohort participants completed surveys during 2008-2011 covering demographics, health-related behaviors, and medical history. Cox proportional hazard models, stratified by birth year, modeled the hazard of each outcome (starting at 20 years of age) as a function of retrospective serum PFOA concentration estimates (generated through fate, transport and exposure modeling), controlling for sex, race, education, smoking, alcohol use, body mass index, and diabetes.

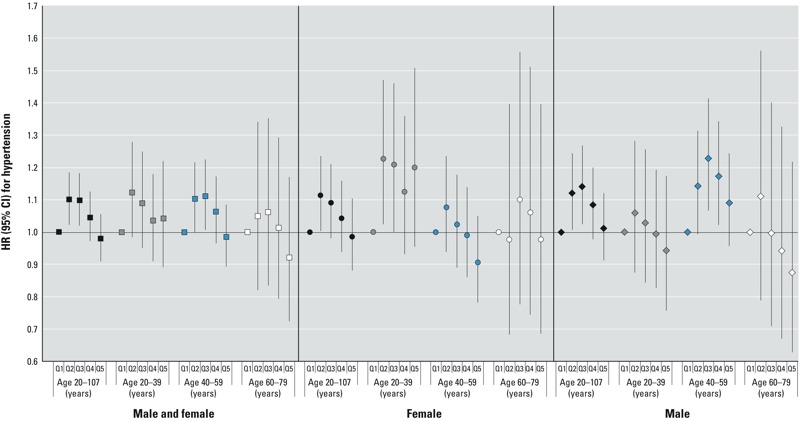
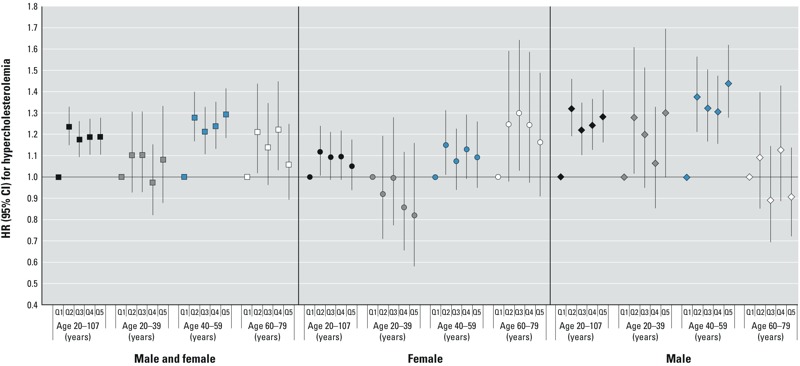
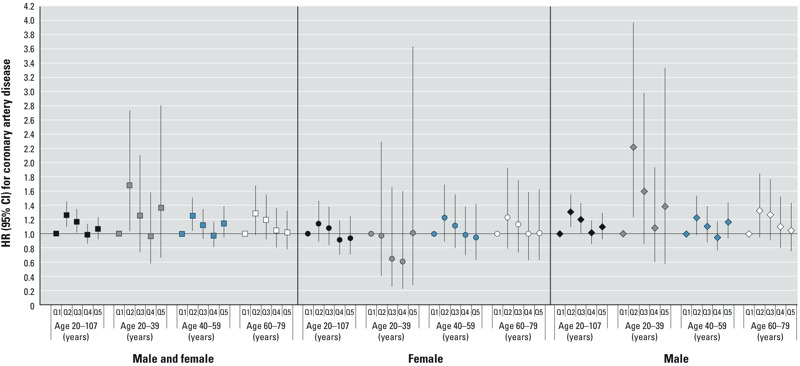
Results: Among 32,254 participants (28,541 community; 3,713 worker), 12,325 reported hypertension with medication, 9,909 reported hypercholesterolemia with medication, and 3,147 reported coronary artery disease (2,550 validated). Hypercholesterolemia incidence increased with increasing cumulative PFOA exposure (sum of yearly serum concentration estimates), most notably among males 40-60 years of age. Compared with the lowest exposure quintile (< 142 ng/mL-years), hazard ratios for subsequent quintiles (ng/mL-years: 142 to < 234; 234 to < 630; 630 to < 3,579; ≥ 3,579) were 1.24, 1.17, 1.19, and 1.19 overall and 1.38, 1.32, 1.31, and 1.44 among men 40-60 years of age. There was no apparent association between PFOA exposure and hypertension or coronary artery disease incidence.

Conclusions: Higher PFOA exposure was associated with incident hypercholesterolemia with medication, but not with hypertension or coronary artery disease.


Conflict of interest statement

The authors declare they have no actual or potential competing financial interests.

Figures

Figure 1
Figure 1
HRs and 95% CIs for hypertension in the primary retrospective analysis for the combined cohorts, cumulative exposure. Quintile (Q) cut points (μg/mL per year) were < 0.111, 0.111 to < 0.191, 0.191 to < 0.471, 0.471 to < 2.763, ≥ 2.763. The analysis included 11,798 cases of self-reported hypertension with medication. Models were stratified by single-year birth year and were either stratified by sex or controlled for sex and the interaction between sex and age. Models also controlled for years of schooling (not time-varying; < 12 years, high school diploma/GED, some college, or ≥ bachelor’s degree), race (white vs. nonwhite or missing), smoking (time-varying; current, former, none), smoking duration (time-varying), smoking pack-years (time-varying linear term created by multiplying the self-reported number of packs smoked per day by the smoking duration to that point), regular alcohol consumption (time-varying; current, former, none), BMI (at time of first study survey; underweight, normal, overweight, obese), and self-reported type 2 diabetes (time-varying according to reported age at diagnosis).
Figure 2
Figure 2
HRs and 95% CIs for hypercholesterolemia in the primary retrospective analysis for the combined cohorts, cumulative exposure. Quintile (Q) cut points (μg/mL per year) were < 0.142, 0.142 to < 0.234, 0.234 to < 0.630, 0.630 to < 3.579, ≥ 3.579. The analysis included 9,653 cases of self-reported hypercholesterolemia with medication. Models were stratified by single-year birth year and were either stratified by sex or controlled for sex and the interaction between sex and age. Models also controlled for years of schooling (not time-varying; < 12 years, high school diploma/GED, some college, or ≥ bachelor’s degree), race (white vs. nonwhite or missing), smoking (time-varying; current, former, none), smoking duration (time-varying), smoking pack-years (time-varying linear term created by multiplying the self-reported number of packs smoked per day by the smoking duration to that point), regular alcohol consumption (time-varying; current, former, none), BMI (at time of first study survey; underweight, normal, overweight, obese), and self-reported type 2 diabetes (time-varying according to reported age at diagnosis).
Figure 3
Figure 3
HRs and 95% CIs for coronary artery disease in the primary retrospective analysis for the combined cohorts, cumulative exposure. Quintile (Q) cut points (μg/mL per year) were < 0.147, 0.14 to < 0.248, 0.248 to < 0.717, 0.717 to < 5.058, ≥ 5.058. The analysis included 2,468 cases of validated coronary artery disease. Models were stratified by single-year birth year and were either stratified by sex or controlled for sex and the interaction between sex and age. Models also controlled for years of schooling (not time-varying; < 12 years, high school diploma/GED, some college, or ≥ bachelor’s degree), race (white vs. nonwhite or missing), smoking (time-varying; current, former, none), smoking duration (time-varying), smoking pack-years (time-varying linear term created by multiplying the self-reported number of packs smoked per day by the smoking duration to that point), regular alcohol consumption (time-varying; current, former, none), BMI (at time of first study survey; underweight, normal, overweight, obese), and self-reported type 2 diabetes (time-varying according to reported age at diagnosis).

Comment in

References

    1. Applebaum KM, Malloy EJ, Eisen EA. Left truncation, susceptibility, and bias in occupational cohort studies. Epidemiology. 2011;22:599–606. - PMC - PubMed
    1. Bartell SM, Calafat AM, Lyu C, Kato K, Ryan PB, Steenland K.2010Rate of decline in serum PFOA concentrations after granular activated carbon filtration at two public water systems in Ohio and West Virginia. Environ Health Perspect 118222–228.; 10.1289/ehp.0901252 - DOI - PMC - PubMed
    1. Costa G, Sartori S, Consonni D. Thirty years of medical surveillance in perfluooctanoic acid production workers. J Occup Environ Med. 2009;51:364–372. - PubMed
    1. Emmett EA, Zhang H, Shofer FS, Freeman D, Rodway NV, Desai C, et al. Community exposure to perfluorooctanoate: relationships between serum levels and certain health parameters. J Occup Environ Med. 2006;48:771–779. - PMC - PubMed
    1. Eriksen KT, Raaschou-Nielsen O, McLaughlin JK, Lipworth L, Tjønneland A, Overvad K, et al. 2013Association between plasma PFOA and PFOS levels and total cholesterol in a middle-aged Danish population. Plos One 82e56969; 10.1371/journal.pone.0056969 - DOI - PMC - PubMed

Publication types

MeSH terms

LinkOut - more resources