. 2014 Oct 29;42(19):12272-83.
doi: 10.1093/nar/gku855. Epub 2014 Sep 26.

μABC: a systematic microsecond molecular dynamics study of tetranucleotide sequence effects in B-DNA

Affiliations

μABC: a systematic microsecond molecular dynamics study of tetranucleotide sequence effects in B-DNA

Marco Pasi et al. Nucleic Acids Res. .

Abstract

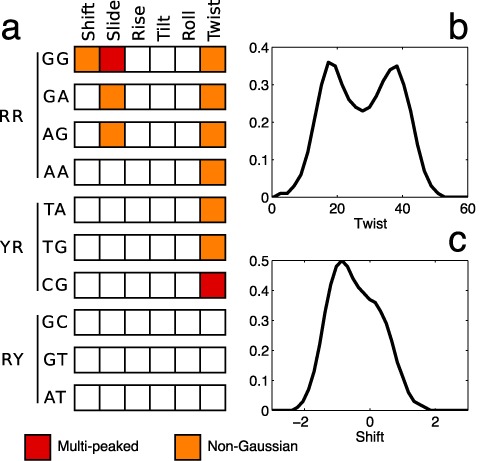
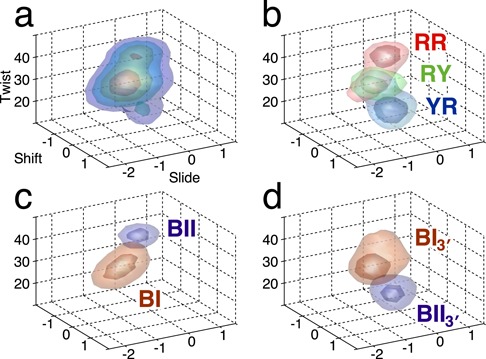
We present the results of microsecond molecular dynamics simulations carried out by the ABC group of laboratories on a set of B-DNA oligomers containing the 136 distinct tetranucleotide base sequences. We demonstrate that the resulting trajectories have extensively sampled the conformational space accessible to B-DNA at room temperature. We confirm that base sequence effects depend strongly not only on the specific base pair step, but also on the specific base pairs that flank each step. Beyond sequence effects on average helical parameters and conformational fluctuations, we also identify tetranucleotide sequences that oscillate between several distinct conformational substates. By analyzing the conformation of the phosphodiester backbones, it is possible to understand for which sequences these substates will arise, and what impact they will have on specific helical parameters.


Figures

Figure 1.
Figure 1.
Tetranucleotide sequence effects on inter base pair helical parameter averages. For each parameter, the average value and the standard deviation for the 10 distinct dinucleotide steps (along the abscissa, underlined to show the RR, RY and YR families) are shown by the thick black horizontal lines and surrounding boxes. The impact of the flanking base pair steps on each of these values is shown by the colored horizontal lines: R..R (red), R..Y (green), Y..R (blue), and Y..Y (orange). The extreme values of the averages for each dinucleotide step are indicated by the corresponding flanking sequences.
Figure 2.
Figure 2.
Tetranucleotide sequence effects on inter base pair helical parameter variance. For each of the 10 distinct dinucleotide steps (along the abscissa, underlined to show the RR, RY and YR families), the mean variance is indicated by the thick black horizontal lines and the thin vertical bars. The values for the different families of flanking base pairs are indicated by the colored horizontal lines: R..R (red), R..Y (green), Y..R (blue), and Y..Y (orange). The extreme values of variance for each dinucleotide step are indicated by the corresponding flanking sequences.
Figure 3.
Figure 3.
Helical parameter distributions. All inter-BP parameter distributions (shift, slide and twist) showing evident non-Gaussian or multi-peaked behavior. The distributions are grouped according to the central base pair step (all four RR steps appear in the left two columns, and all three distinct YR steps in the right-hand column), and are colored on the basis of the four possible types of flanking sequence (with only three distinct cases for the two self-symmetric dinucleotides).
Figure 4.
Figure 4.
Non-Gaussian and multi-peaked helical parameter distributions. (a) Probability distributions of the inter-BP parameters for the central base pair step of the 136 distinct tetranucleotide sequences were inspected for visible deviations from Gaussian behavior. Helical parameters classed as ‘Multi-peaked’ (red) have two distinct peaks in their distributions for most flanking sequences. Monomodal distributions with obvious deviations from normality (such as pronounced shoulders or asymmetry) for most flanking sequences are classed as ‘Non-Gaussian’ (orange). The results are grouped on the basis of the purine/pyrimidine family of the dinucleotide step. Examples of parameter distributions (see also Figure 3) are shown for the twist of AGCA ((b), multi-peaked) and the shift of TGGT ((c), non-Gaussian).
Figure 5.
Figure 5.
Sequence dependence of BII backbone conformations. The percentage occurrence of BII backbone states for the phosphodiester junction of each of the 10 distinct base pair steps is shown. For each step, the results for the Watson and Crick strands are plotted as colored bars on the left and right of the vertical black line (for self-complementary steps, GC, AT, TA and CG, the two strands are indistinguishable and only one column of results is plotted). Each bar refers to one of the 136 distinct tetranucleotide fragments, colored according to its sequence on the Watson strand.
Figure 6.
Figure 6.
Sequence-dependent formation of C8-H…O3′ hydrogen bonds. The percentage occurrence of C8-H…O3′ hydrogen bonds involving a 3′-purine and the junction phosphate of the 10 distinct dinucleotide steps is shown. For each step, the results for the Watson and Crick strands are plotted as colored bars on the left and right of the vertical black line (for self-complementary steps, GC, AT, TA and CG, the two strands are indistinguishable and only one column of results is plotted). Each bar refers to one of the 136 distinct tetranucleotide fragments, colored according to its sequence on the Watson strand. Note that 3′-pyrimidines (and thus all RY steps) cannot form this hydrogen bond. The inset is a stick representation of a GG base pair step showing the atoms involved in the formation of the C8-H…O3′ hydrogen bond.
Figure 7.
Figure 7.
Partial cross correlation matrices between helical parameters and the ζ (O3′-P) backbone torsion. Cross correlations of the inter-BP parameters, shift (H), slide (L), rise (R), tilt (I), roll (O) and twist (T) and backbone torsion ζ are shown at three consecutive levels, grouped according to the central dinucleotide step. Positive correlations >0.4 are shown in red and negative correlations <–0.4 are shown in blue. The schematic representation of a double-stranded tetranucleotide fragment on the right defines the naming convention for the ζ torsions and the six backbone segments: inter-BP parameters refer to the central junction (*) and are grouped according to the dinucleotide sequence at levels i and i+1 on the Watson strand.
Figure 8.
Figure 8.
Probability density as a function of shift, slide and twist. (a) Probability density isosurfaces (generated from uniform bin histograms) shown at four evenly spaced levels as a function of the inter-BP parameters shift, slide and twist averaged over all tetranucleotides. The surfaces enclose the most densely populated region of this conformational space, i.e. the peaks of the distribution (namely, 15%, 30%, 45% and 60% of the maximum density). (b) Same as (a), but dividing the probability density into RR (red), RY (green) and YR (blue) sequences for the corresponding base pair step (see the main text for the precise definition of the RY and YR groups). In this case, only the two innermost isodensity surfaces are shown for each sequence group. (c) RR steps are further subdivided according to the BI/BII conformational state of the Watson backbone in the base pair step. (d) YR steps are further subdivided according to the conformational state of the 3′-junctions: BI3′ indicates that both 3′-junctions (W3′ and C3′ in Figure 7) are in the BI state, and BII3′ indicates that at least one of these junctions is in the BII state.

References

    1. Wing R., Drew H., Takano T., Broka C., Tanaka S., Itakura K., Dickerson R.E. Crystal structure analysis of a complete turn of B-DNA. Nature. 1980;287:755–758. - PubMed
    1. Drew H.R., Wing R.M., Takano T., Broka C., Tanaka S., Itakura K., Dickerson R.E. Structure of a B-DNA dodecamer: conformation and dynamics. Proc. Natl Acad. Sci. U.S.A. 1981;78:2179–2183. - PMC - PubMed
    1. Juo Z.S., Chiu T.K., Leiberman P.M., Baikalov I., Berk A.J., Dickerson R.E. How proteins recognize the TATA box. J. Mol. Biol. 1996;261:239–254. - PubMed
    1. Dickerson R.E., Chiu T.K. Helix bending as a factor in protein/DNA recognition. Biopolymers. 1997;44:361–403. - PubMed
    1. Paillard G., Lavery R. Analyzing protein-DNA recognition mechanisms. Structure. 2004;12:113–122. - PubMed

Publication types