. 2014 Dec 1;42(21):e163.
doi: 10.1093/nar/gku869. Epub 2014 Sep 26.

NLS-tagging: an alternative strategy to tag nuclear proteins

Affiliations

NLS-tagging: an alternative strategy to tag nuclear proteins

Guillaume Giraud et al. Nucleic Acids Res. .

Abstract

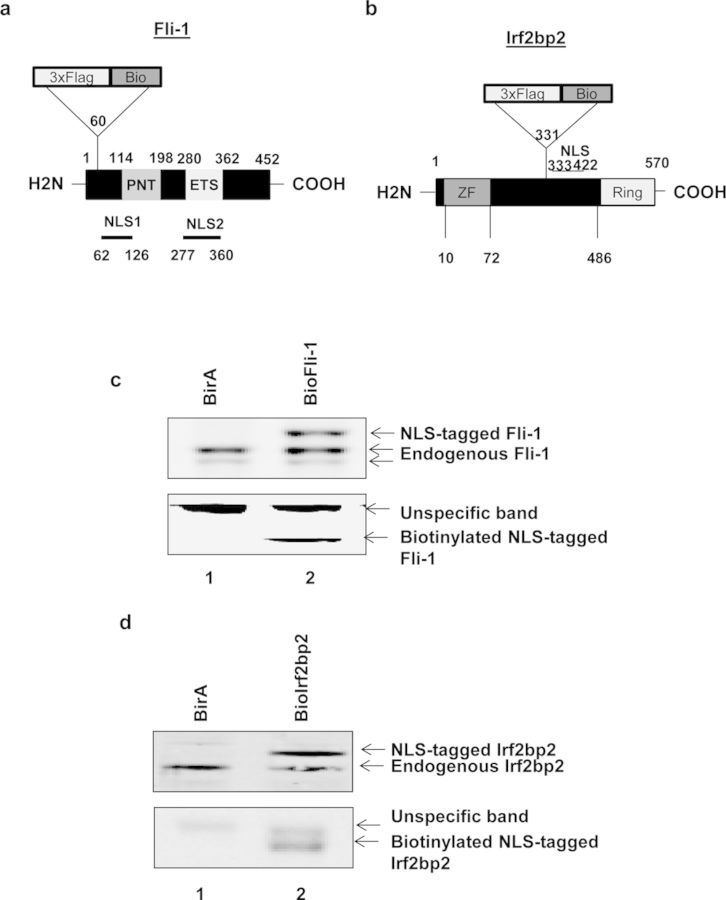
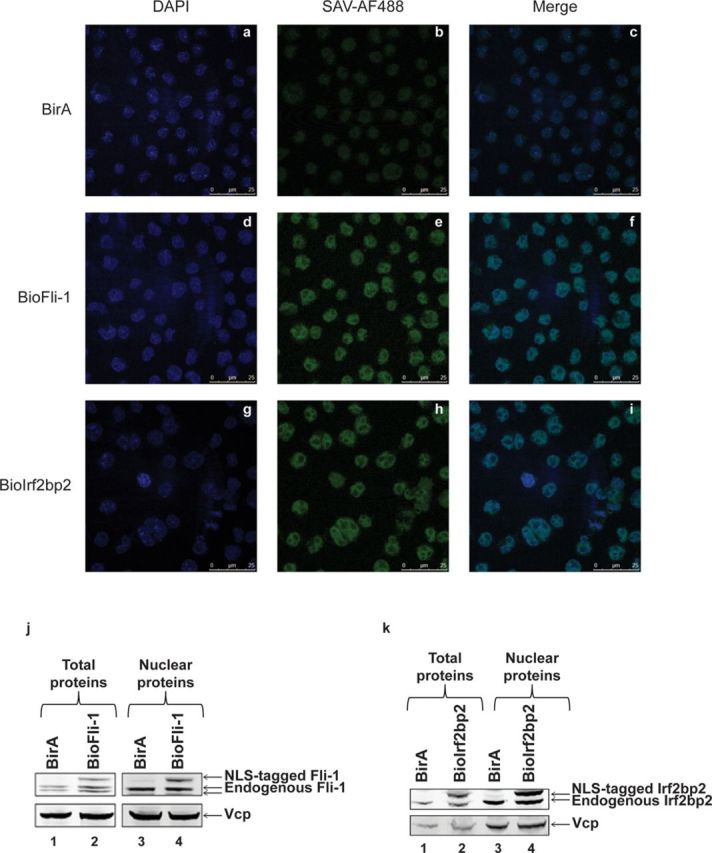
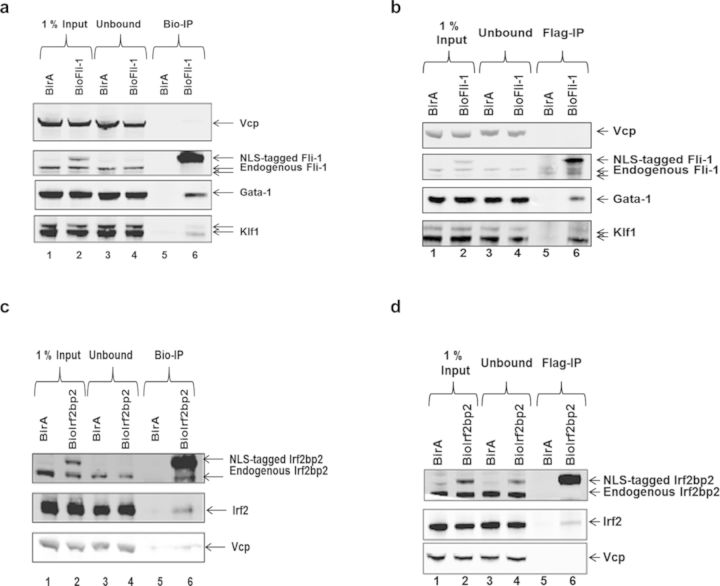
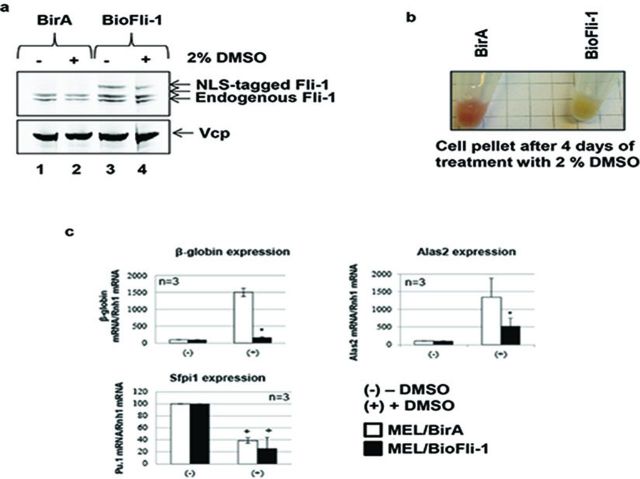
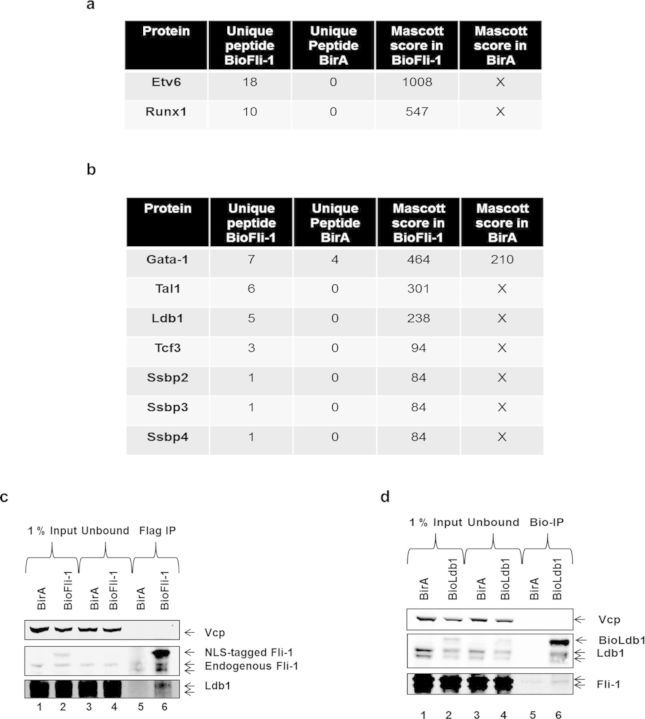
The characterization of transcription factor complexes and their binding sites in the genome by affinity purification has yielded tremendous new insights into how genes are regulated. The affinity purification requires either the use of antibodies raised against the factor of interest itself or by high-affinity binding of a C- or N-terminally added tag sequence to the factor. Unfortunately, fusing extra amino acids to the termini of a factor can interfere with its biological function or the tag may be inaccessible inside the protein. Here, we describe an effective solution to that problem by integrating the 'tag' close to the nuclear localization sequence domain of the factor. We demonstrate the effectiveness of this approach with the transcription factors Fli-1 and Irf2bp2, which cannot be tagged at their extremities without loss of function. This resulted in the identification of novel proteins partners and a new hypothesis on the contribution of Fli-1 to hematopoiesis.


Figures

Figure 1.
Figure 1.
Expression of NLS-tagged Fli-1 and Irf2bp2 proteins in MEL cells. (a) Schematic depicting Fli-1 protein domain organization and the 3×Flag-Bio tag integration site. The Fli-1 pointed (PNT) domain is involved in the interaction with other proteins, the ETS domain is the DNA binding domain. Fli-1 has two NLSs localized between aminoacids 62 and 126 (NLS1) and between aminoacids 277 and 360 (NLS2). The 3×Flag and BirA target sequence (Bio) were integrated in between amino acids 60 and 61, just before the NLS1. (b) Schematic depicting Irf2bp2 protein domain organization and the 3×Flag-Bio tag integration site. Irf2bp2 contains one zinc finger (ZF) and one RING domain. The NLS of this factor is localized between amino acids 333 and 422. The 3×Flag and Bio sequences were integrated in between amino acids 331 and 332. (c and d) Total proteins were extracted from either MEL/BirA, MEL/BioFli-1 (c) or MEL/BioIrf2bp2 (d) cells and subjected to Western blot analysis. Membranes were probed using an antibody against the endogenous proteins (top) or using streptavidin (bottom).
Figure 2.
Figure 2.
Proper nuclear localization of the NLS-tagged proteins in MEL cells. (a–i) Immunofluorescence experiments in MEL/BirA (a, b, c), MEL/BioFli-1 (d, e, f) and MEL/BioIrf2bp2 (g, h, i) cells using either DAPI (a, d, g) or streptavidin conjugated with Alexa fluor 488 (b, e, h). The figure c, f and i show the merged picture. (j and k) Total (lanes 1 and 2) and nuclear (lanes 3 and 4) proteins were extracted from MEL/BirA (lanes 1 and 3), MEL/BioFli-1 (j, lanes 2 and 4) and MEL/BioIrf2bp2 (k, lanes 2 and 4) and subjected to Western blot analysis. Membranes were probed using an antibody against the endogenous protein (top panel) or against Vcp (bottom panel, loading control).
Figure 3.
Figure 3.
NLS-tagged Fli-1 and Irf2bp2 interact with endogenous interacting proteins. (a) Streptavidin-IP on nuclear extracts from MEL-BirA (lanes 1 and 3) or MEL/BioFli-1 cells (lanes 2 and 4) followed by Western blot analysis of Vcp (top panel, loading control), the endogenous and the NLS-tagged Fli-1 proteins (middle top panel), Gata-1 (middle bottom panel) and Klf1 (bottom panel). The picture is representative of two independent experiments. (b) Flag-IP of nuclear extracts from MEL/BirA (lanes 1 and 3) or MEL/BioFli-1 cells (lanes 2 and 4) followed by Western blot analysis of Vcp (top panel, loading control), the endogenous and the NLS-tagged Fli-1 proteins (middle top panel), Gata-1 (middle bottom panel) and Klf1 (bottom panel). The picture is representative of two independent experiments. (c) Streptavidin-IP of nuclear extracts from MEL/BirA (lines 1 and 3) or MEL/BioIrf2bp2 cells (line 2 and 4) followed by Western blot analysis of the endogenous and the NLS-tagged Irf2bp2 proteins (top panel), Irf2 (middle panel) and Vcp (bottom panel, loading control). The picture is representative of two independent experiments. (d) Flag-IP of nuclear extracts from MEL/BirA (lines 1 and 3) or MEL/BioIrf2bp2 cells (lines 2 and 4) followed by Western blot analysis of the endogenous and the NLS-tagged Irf2bp2 proteins (top panel), Irf2 (middle panel) and Vcp (bottom panel). The picture is representative of two independent experiments.
Figure 4.
Figure 4.
NLS-tagged Fli-1 and Irf2bp2 are recruited to the endogenous protein target regions. (a) ChIP experiments with the anti-Fli-1 antibody (black bars) or the Control IgG (white bars) from MEL cells followed by qPCR using primers amplifying β-amylase (control region), Fli-1 promoter, Nip7 promoter and a region within the Tgfb1 locus. Data represents the average of three independent experiments; error bars denote standard deviation. (b) Streptavidin-ChIP from MEL/BirA (white bars) and MEL/BioFli-1 (black bars) cells followed by qPCR using primers amplifying β-amylase (control region), Fli-1 promoter, Nip7 promoter and a region within the Tgfb1 locus. Data represents the average of six independent experiments; error bars denote standard deviation, *P < 0.05, Student's t-test between MEL/BirA and MEL/BioFli-1 cells. (c) Genome-wide Irf2bp2 binding sites in MEL cells were identified by ChIP-Seq experiments. The different Irf2bp2 genomic binding regions can be visualized by the UCSC genome browser. For example, Irf2bp2 binds a region within the tgfb1 locus, the nip7 gene promoter, the fli-1 gene promoter and two known enhancers of c-myb gene (BS1: Myb −36 kb; BS5: Myb −68 kb). (d) Streptavidin-ChIP from MEL/BirA (white bars) and MEL/BioIrf2bp2 (black bars) cells followed by qPCR using primers amplifying β-amylase (control region), Myb −36 kb (BS1), Myb −68 kb (BS5), Fli-1 promoter, Nip7 promoter and a region within the Tgfb1 locus. Data represents the average of the signal for six independent experiments; error bars denote standard deviation, *P < 0.05, Student's t-test between MEL/BirA and MEL/BioIrf2bp2.
Figure 5.
Figure 5.
NLS-tagged Fli-1 inhibits erythroid differentiation of MEL cells. (a) Total proteins extracted from MEL/BirA (lanes 1 and 2) and MEL/BioFli-1 (lanes 3 and 4) cells cultured for 4 days in presence (lanes 2 and 4) or in absence (lanes 1 and 3) of 2% DMSO were subjected to western blot analysis. Membranes were probed using an antibody against the endogenous protein (top panel) or the Vcp protein (bottom panel, loading control). The figure is representative of three independent experiments. (b) Pellet of MEL/BirA (left tube) and MEL/BioFli-1 (right tube) cells after 4 days of DMSO treatment. (c) RT-qPCR experiments on MEL/BirA (white bars) and MEL/BioFli-1 (black bars) cells measuring the expression of β-globin (top left panel), alas2 (top right panel) and sfpi1 (bottom panel). Data represents the average of three independent experiments; error bars denote standard deviation. *P < 0.05, Student's t-test between MEL/BirA and MEL/BioFli-1 cells. +P < 0.05, Student's t-test between untreated and DMSO treated cells.
Figure 6.
Figure 6.
Fli-1 interacts with several members of the Ldb1 complex in MEL cells. (a) Streptavidin-IP from MEL/BirA (BirA) and MEL/BioFli-1 (BioFli-1) nuclear extracts followed by MS was used to identify new Fli-1 protein partners in MEL cells. Table shows the number of peptides detected in both MEL cells and their corresponding Mascott scores for two known Fli-1 interacting proteins : ETV6 (26) and Runx1 (27). (b) Table depicting several Fli-1 interacting proteins detected by MS belonging to the Ldb1 complex. (c) Flag-IP from MEL/BirA (BirA) (lanes 1, 3 and 5) and MEL/BioFli-1 (lanes 2, 4 and 6) nuclear extracts followed by Western blot analysis of Vcp (top panel, loading control), the endogenous and the NLS-tagged Fli-1 proteins (middle panel) and the Ldb1 protein (bottom panel). The picture is representative of two independent experiments. (d) Streptavidin-IP from MEL/BirA (BirA) (lanes 1, 3 and 5) and MEL/BioLdb1 (BioLdb1) (lanes 2, 4 and 6) nuclear extracts followed by Western blot analysis of Vcp (top panel, loading control), the endogenous and tagged Ldb1 proteins (middle panel) and the Fli-1 protein (bottom panel). The picture is representative of two independent experiments.

References

    1. Farnham P.J. Insights from genomic profiling of transcription factors. Nat. Rev. Genet. 2009;10:605–616. - PMC - PubMed
    1. Soler E., Andrieu-Soler C., de Boer E., Bryne J.C., Thongjuea S., Stadhouders R., Palstra R.J., Stevens M., Kockx C., van Ijcken W., et al. The genome-wide dynamics of the binding of Ldb1 complexes during erythroid differentiation. Genes Dev. 2010;24:277–289. - PMC - PubMed
    1. Grosveld F., Rodriguez P., Meier N., Krpic S., Pourfarzad F., Papadopoulos P., Kolodziej K., Patrinos G.P., Hostert A., Strouboulis J. Isolation and characterization of hematopoietic transcription factor complexes by in vivo biotinylation tagging and mass spectrometry. Ann. N. Y. Acad. Sci. 2005;1054:55–67. - PubMed
    1. Pilon A.M., Ajay S.S., Kumar S.A., Steiner L.A., Cherukuri P.F., Wincovitch S., Anderson S.M., Center N.C.S., Mullikin J.C., Gallagher P.G., et al. Genome-wide ChIP-Seq reveals a dramatic shift in the binding of the transcription factor erythroid Kruppel-like factor during erythrocyte differentiation. Blood. 2011;118:e139–148. - PMC - PubMed
    1. Soler E., Andrieu-Soler C., Boer E., Bryne J.C., Thongjuea S., Rijkers E., Demmers J., Ijcken W., Grosveld F. A systems approach to analyze transcription factors in mammalian cells. Methods. 2011;53:151–162. - PubMed

Publication types

MeSH terms

Substances

LinkOut - more resources