Review
. 2014 Nov 1;592(21):4613-26.
doi: 10.1113/jphysiol.2014.279380. Epub 2014 Sep 25.

Misinterpretation of the mouse ECG: 'musing the waves of Mus musculus'

Affiliations
Review

Misinterpretation of the mouse ECG: 'musing the waves of Mus musculus'

Bastiaan J Boukens et al. J Physiol. .

Abstract

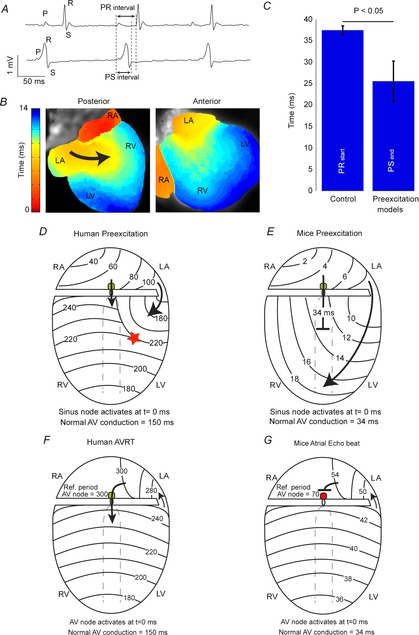
The ECG is a primary diagnostic tool in patients suffering from heart disease, underscoring the importance of understanding factors contributing to normal and abnormal electrical patterns. Over the past few decades, transgenic mouse models have been increasingly used to study pathophysiological mechanisms of human heart diseases. In order to allow extrapolation of insights gained from murine models to the human condition, knowledge of the similarities and differences between the mouse and human ECG is of crucial importance. In this review, we briefly discuss the physiological mechanisms underlying differences between the baseline ECG of humans and mice, and provide a framework for understanding how these inherent differences are relevant to the interpretation of the mouse ECG during pathology and to the translation of the results from the mouse to man.


Figures

Figure 1
Figure 1. Six lead ECG of a human and a mouse
A and B, schematic drawings of the positions of the leads R, L and F in humans and mice, respectively. C, the triangle of Einthoven. D and E, schematic standard six lead ECGs of a human and a mouse, respectively.
Figure 2
Figure 2. The action potentials of isolated human and murine ventricular myocytes in relation to the species-specific patterns on the electrocardiogram
A, schematic representation of the human (left) and murine (right) ECG. Note that in the mouse the ST segment is not isoelectric, but instead has a characteristic J wave that represents early repolarization. B, schematic action potentials representing the myocardium activated earliest (continuous line) and latest (dashed line) in human (left) and mouse (right). Note that the murine action potential has a large initial repolarization phase and a plateau phase at a lower membrane potential. C, schematic representation of the different currents underlying the action potential in humans (left) and mice (right) Modified from Nerbonne & Kass (2005). This figure is inspired by Salama & London (2007).
Figure 3
Figure 3. The QRS complex is not a good measure of total ventricular activation time in mice
A, during normal cardiac activation sequence the end of ventricular activation corresponds to the end of the QRS complex in aVF. B, when conduction in the myocardium is slow (Ajmaline) then the QRS complex (red star) ends before final ventricular activation (blue star). ‘First LV’ and ‘last RV’ represent optical signals from the epicardial regions denoted in the reconstructed activation patterns. C, a simulated action potential with (black), and without (red), early repolarization. D, a calculated ECG based on action potentials simulated with, and without, early repolarization as shown in C. Note that altering early repolarization can change QRS duration even when ventricular conduction is not altered. Modified from Boukens et al. (2013).
Figure 4
Figure 4. The mouse ECG in different situations
A, non-corrected QT (left) and corrected QT intervals (right) in all mice (n = 6) at each paced cycle length. Linear regressions of the QT–RR and QTc–RR relationships of the individual mice were averaged to derive the two general trend lines. The trend lines are expanded for illustration purposes. B, unprocessed (left) and averaged electrocardiogram (ECG; right) traces from lead II recorded during ischaemia. Ischaemia produced a prolonged QRS interval and a JT segment with a positive, large T wave (n = 6). C, unprocessed (left) and averaged electrocardiogram (ECG; right) traces from lead II recorded in mice with heart failure. Mice with heart failure showed a significant prolongation of the QRS and QT interval compared with sham-operated mice (data not shown). In addition, mice with heart failure presented entirely negative and inseparable J and T waves (n = 6). However, the end of the T wave was still visible compared with baseline ECG recordings. Modified from Speerschneider & Thomsen (2013).
Figure 5
Figure 5. Preexcitation and atrioventricular tachycardia in the mouse heart
A, an ECG recorded from wild-type (upper) and aMyh6-cre;Tbx2fl/fl mice (lower) showing ventricular preexcitation. B, the reconstructed activation pattern from a sinus beat recorded from a aMyh6-cre;Tbx2fl/fl mouse. Note that the ventricle is completely activated via the accessory pathway and that no collision of two waves can be detected. C, a bar graph showing the average PR interval of control mice and the average PSend interval in mice models with preexcitation (Arad et al. ; Gaussin et al. ; Sidhu et al. ; Davies et al. ; Wolf et al. ; Aanhaanen et al. 2011). Note that the QRS complex in the mutant mice ends before the start of the QRS complex in the control mice. D and E, schematic representations of ventricular activation during preexcitation in human and mice hearts, respectively. F, a schematic representation of atrioventricular reentry tachycardia in human heart. G, atrial echo beat in mouse. Modified from Aanhaanen et al. (2011) and Durrer et al. (1967).
Figure 6
Figure 6. Reentry in the mouse heart
A and B, reconstructed activation pattern in which one activation front (A) activates the same area for the second time (B). C, isolated action potentials corresponding to the area indicated by the letters in A and B (authors’ own observations.)

References

    1. Aanhaanen WT, Boukens BJ, Sizarov A, Wakker V, de Gier-de VC, van Ginneken AC, Moorman AF, Coronel R. Christoffels VM. Defective Tbx2-dependent patterning of the atrioventricular canal myocardium causes accessory pathway formation in mice. J Clin Invest. 2011;121:534–544. - PMC - PubMed
    1. Alders M, Koopmann TT, Christiaans I, Postema PG, Beekman L, Tanck MW, Zeppenfeld K, Loh P, Koch KT, Demolombe S, Mannens MM, et al. Haplotype-sharing analysis implicates chromosome 7q36 harboring DPP6 in familial idiopathic ventricular fibrillation. Am J Hum Genet. 2009;84:468–476. - PMC - PubMed
    1. Allessie MA, Bonke FI. Schopman FJ. Circus movement in rabbit atrial muscle as a mechanism of tachycardia. III. The “leading circle” concept: a new model of circus movement in cardiac tissue without the involvement of an anatomical obstacle. Circ Res. 1977;41:9–18. - PubMed
    1. Antzelevitch C. Cardiac repolarization. The long and short of it. Europace. 2005;7:S3–S9. - PMC - PubMed
    1. Arad M, Moskowitz IP, Patel VV, Ahmad F, Perez-Atayde AR, Sawyer DB, Walter M, Li GH, Burgon PG, Maguire CT, et al. Transgenic mice overexpressing mutant PRKAG2 define the cause of Wolff–Parkinson–White syndrome in glycogen storage cardiomyopathy. Circulation. 2003;107:2850–2856. - PubMed

Publication types

LinkOut - more resources