

Quantitative forecasting of PTSD from early trauma responses: a Machine Learning application
- PMID: 25260752
- PMCID: PMC4252741
- DOI: 10.1016/j.jpsychires.2014.08.017
Quantitative forecasting of PTSD from early trauma responses: a Machine Learning application
Abstract
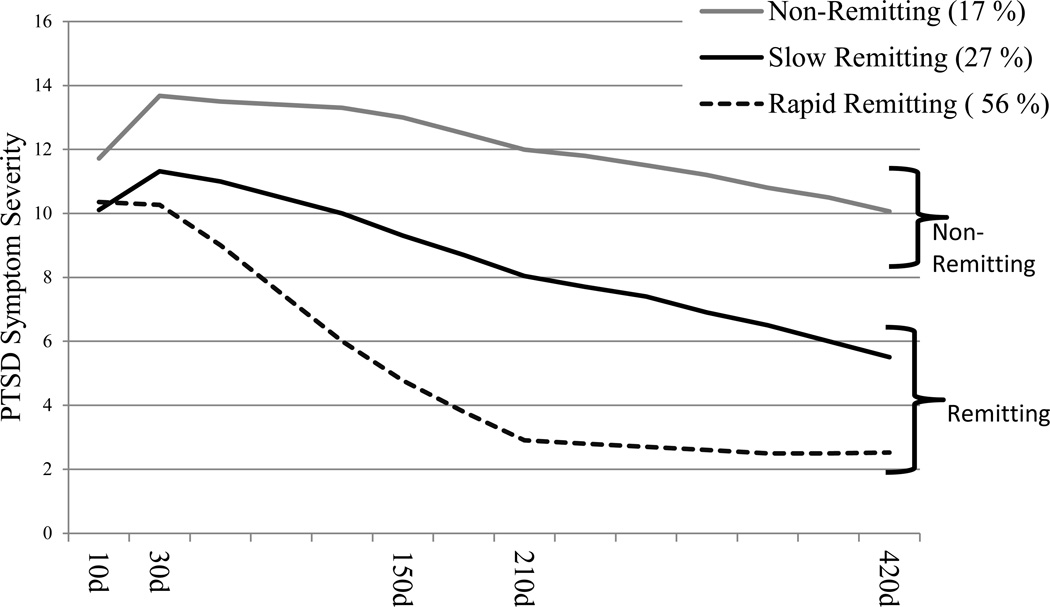
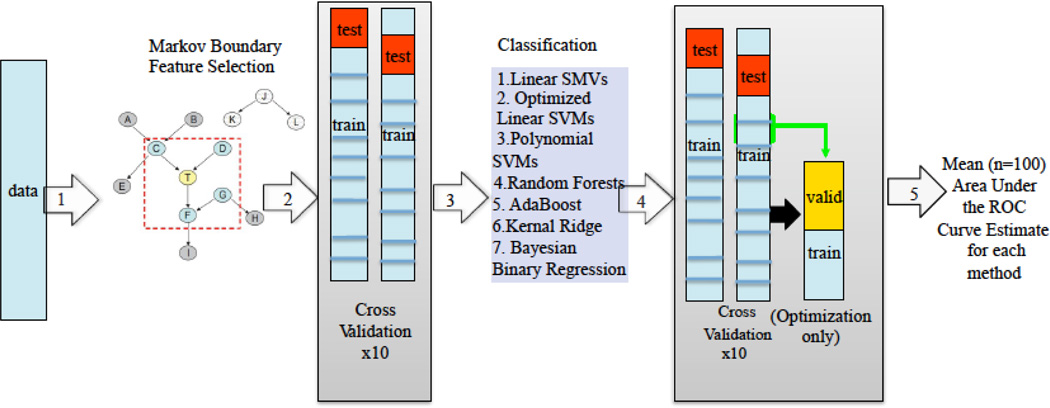
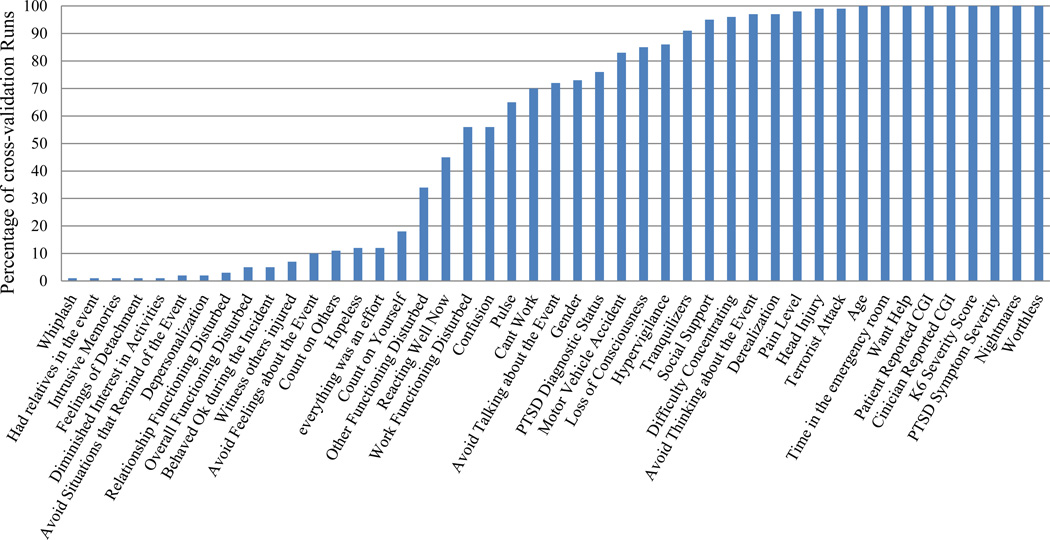
There is broad interest in predicting the clinical course of mental disorders from early, multimodal clinical and biological information. Current computational models, however, constitute a significant barrier to realizing this goal. The early identification of trauma survivors at risk of post-traumatic stress disorder (PTSD) is plausible given the disorder's salient onset and the abundance of putative biological and clinical risk indicators. This work evaluates the ability of Machine Learning (ML) forecasting approaches to identify and integrate a panel of unique predictive characteristics and determine their accuracy in forecasting non-remitting PTSD from information collected within 10 days of a traumatic event. Data on event characteristics, emergency department observations, and early symptoms were collected in 957 trauma survivors, followed for fifteen months. An ML feature selection algorithm identified a set of predictors that rendered all others redundant. Support Vector Machines (SVMs) as well as other ML classification algorithms were used to evaluate the forecasting accuracy of i) ML selected features, ii) all available features without selection, and iii) Acute Stress Disorder (ASD) symptoms alone. SVM also compared the prediction of a) PTSD diagnostic status at 15 months to b) posterior probability of membership in an empirically derived non-remitting PTSD symptom trajectory. Results are expressed as mean Area Under Receiver Operating Characteristics Curve (AUC). The feature selection algorithm identified 16 predictors, present in ≥ 95% cross-validation trials. The accuracy of predicting non-remitting PTSD from that set (AUC = .77) did not differ from predicting from all available information (AUC = .78). Predicting from ASD symptoms was not better then chance (AUC = .60). The prediction of PTSD status was less accurate than that of membership in a non-remitting trajectory (AUC = .71). ML methods may fill a critical gap in forecasting PTSD. The ability to identify and integrate unique risk indicators makes this a promising approach for developing algorithms that infer probabilistic risk of chronic posttraumatic stress psychopathology based on complex sources of biological, psychological, and social information.
Keywords: Course and prognosis; Early prediction; Forecasting; Machine Learning; Markov boundary feature selection; Posttraumatic stress disorder (PTSD); Support Vector Machines.
Copyright © 2014 Elsevier Ltd. All rights reserved.
Figures
References
-
- Aliferis CF, Statnikov A, Tsamardinos I, Mani S, Koutsoukos XD. Local Causal and Markov Blanket Induction for Causal Discovery and Feature Selection for Classification Part I: Algorithms and Empirical Evaluation. J. Mach. Learn. Res. 2010;11:171–234.
-
- Batista GE, Monard MC. An analysis of four missing data treatment methods for supervised learning. Applied Artificial Intelligence. 2003;17(5–6):519–533.
-
- Bradley AP. The use of the area under the ROC curve in the evaluation of machine learning algorithms. Pattern Recognition. 1997;30(7):15.
-
- Breiman L. Random Forests. Machine Learning. 2001;45(1):5–32.
Publication types
MeSH terms
Grants and funding
LinkOut - more resources
Full Text Sources
Other Literature Sources
Medical
Miscellaneous
