

doi: 10.1186/s13059-014-0472-5.
Dynamic evolution of clonal epialleles revealed by methclone
- PMID: 25260792
- PMCID: PMC4242486
- DOI: 10.1186/s13059-014-0472-5
Item in Clipboard
Dynamic evolution of clonal epialleles revealed by methclone
Genome Biol.
.
Abstract
We describe methclone, a novel method to identify epigenetic loci that harbor large changes in the clonality of their epialleles (epigenetic alleles). Methclone efficiently analyzes genome-wide DNA methylation sequencing data. We quantify the changes using a composition entropy difference calculation and also introduce a new measure of global clonality shift, loci with epiallele shift per million loci covered, which enables comparisons between different samples to gauge overall epiallelic dynamics. Finally, we demonstrate the utility of methclone in capturing functional epiallele shifts in leukemia patients from diagnosis to relapse. Methclone is open-source and freely available at https://code.google.com/p/methclone.
Figures
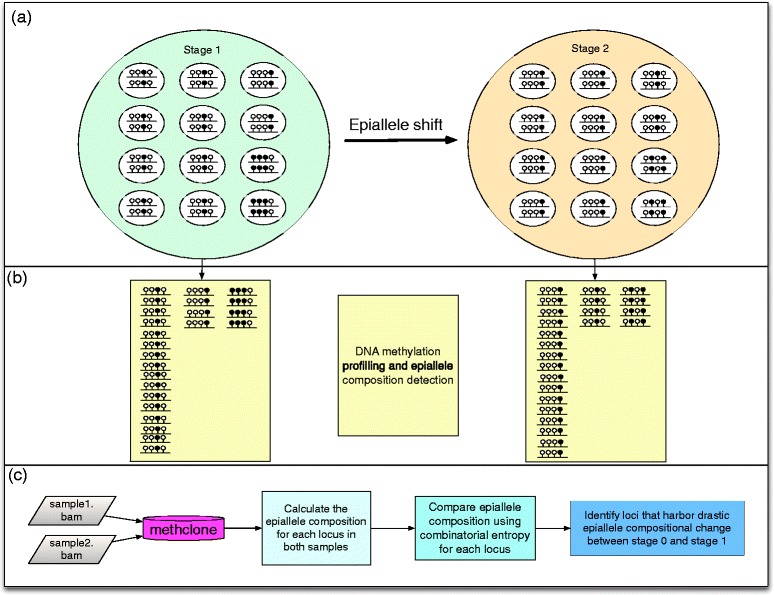
Epiallele shift detection by methclone. (a) Schematic plot of epiallele composition of two stages of cells (biggest circles, light green for stage 1 and light brown for stage 2). Each stage has 12 cells with various epiallele compositions. In each cell, there are two lines, represent two set of epiallele at the same locus. Four circles above each line represent four adjacent CpG sites (black: methylated CpG; white: unmethylated CpG). (b) Bisulfite conversion sequencing output reads that spanning at least four CpG sites will capture the epiallele composition at each stage. (c) methclone workflow. methclone take the bam file from Bismark to calculate the epiallele composition and compare them from different samples. In the application of the combinatorial entropy, methclone determine the loci that harbor significant epiallele compositional change.
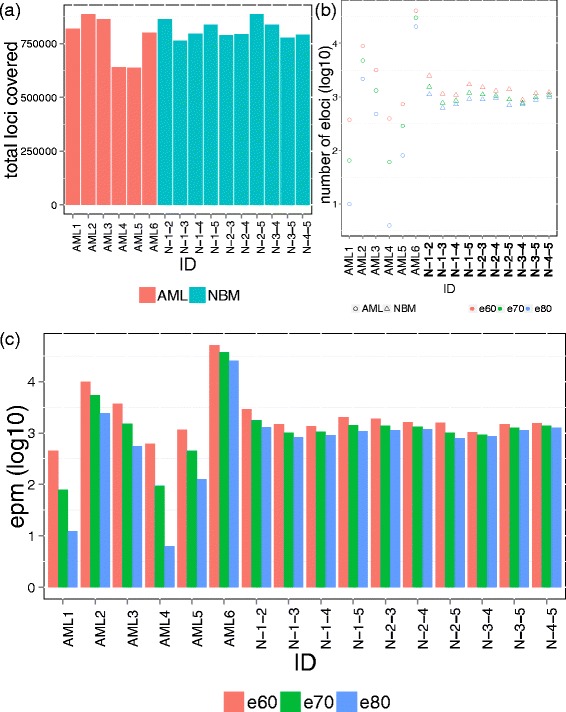
The total number of loci and eloci. (a) The total number of loci composed by four adjacent CpG sites was plotted for each patient. (b) The number of eloci (log 10 transformed) for each patient (pair-wise comparison between diagnosis and relapse) or between normal bone marrow samples using three different combinatorial entropy difference cutoffs (e80: -80, e70: -70, e60: -60). (c) The value EPM (log 10 transformed) for each patient (pair-wise comparison between diagnosis and relapse) or between normal bone marrow samples using three different combinatorial entropy difference cutoffs (e80: -80, e70: -70, e60: -60).
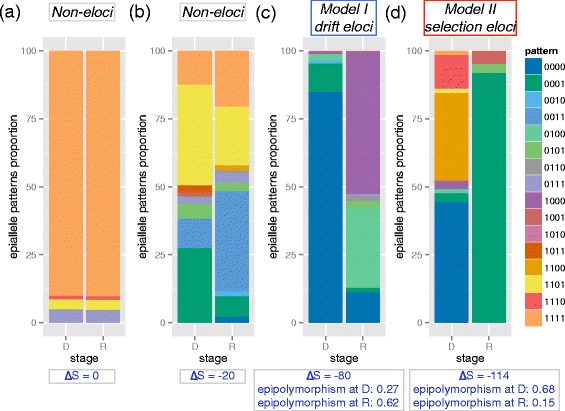
Loci with and without significant epiallele shift. Epiallele pattern proportion change on non-eloci (a, Δ = 0, chr1: 234367244-234367265, SLC35F3 exon), non-eloci (b, Δ
 = -20, chr1: 103319658-103319682, downstream of COL11A1 gene), drift eloci (c, model II, Δ
 = -80, chr16: 330195-330217, epipolymorphism at diagnosis: 0.27, at relapse: 0.62, increased by 0. 35, ARHGDIG promoter) and selection eloci (d, model I, Δ
 = -114 , epipolymorphism at diagnosis:0.68, at relapse: 0.15, decreased by 0. 53, chr10: 109674359- 109674402, SORCS1 distal upstream). Model I is defined as eloci with increased epigenetic tumor heterogeneity measured by epipolymorphism. Model II is defined as eloci with decreased epigenetic tumor heterogeneity measured by epipolymorphism.
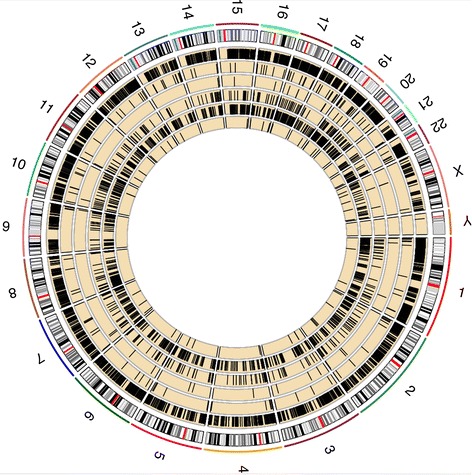
Global epiallele pattern reconstruction between diagnosis and relapse stages. The number at the outer track is the chromosome number. The next track is ideogram of hg19. The five yellow tracks are AML1-6 from inwardly. Black bar in each yellow track stands for eloci determined using -70 as combinatorial entropy cutoff.
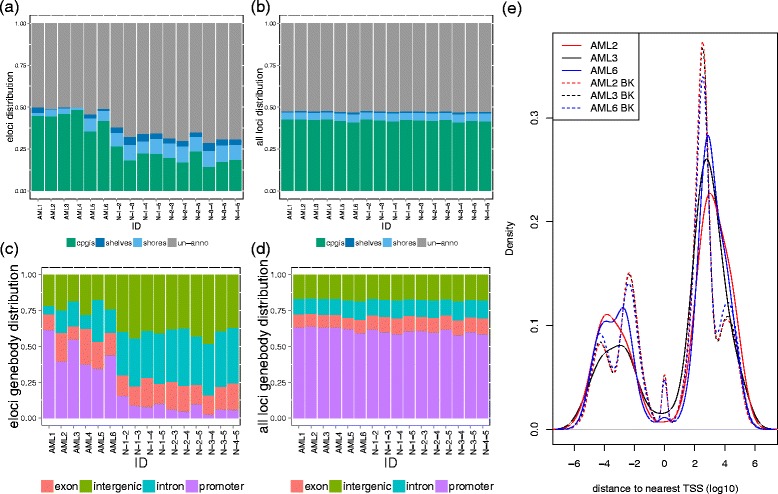
Genome distribution of the eloci during leukemia progression. (a, b) The distribution of eloci (a) and background loci (b) in CpG islands, shores, shelves, and the rest of the genome. (c,
d) The distribution of eloci (c) and background loci (d) in promoter, exon, intron of RefSeq gene model and intergenic regions. (a-
d) eloci from pairwise comparison of five NBM were also plotted to compare and contrast with the eloci during leukemia progression. (e) The density plot of the distances of the eloci (solid lines) and background loci (BK: dashed lines) to the nearest transcription starting sites (TSS) in log10 scale for AML2 (red), AML3 (black), and AML6 (blue).
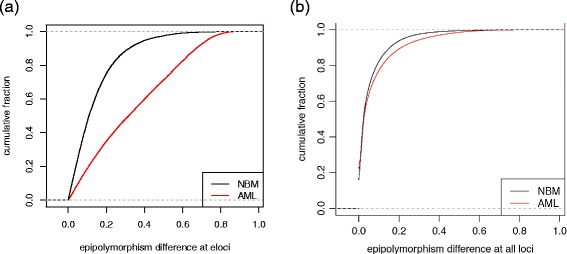
Higher epigenetic heterogeneity changes observed in loci with significant epiallele shift in AML, compared to those from NBM. (a) Significantly higher absolute epipolymorphism difference at eloci between AML pairs than eloci from pairwise comparison of five NBM samples (P value <10-16, Wilcoxon rank sum test with continuity correction). (b) Cumulative fraction of absolute epipolymorphism difference for all loci covered in AML samples and NBM samples.
References
-
- Ding L, Ley TJ, Larson DE, Miller CA, Koboldt DC, Welch JS, Ritchey JK, Young MA, Lamprecht T, McLellan MD, McMichael JF, Wallis JW, Lu C, Shen D, Harris CC, Dooling DJ, Fulton RS, Fulton LL, Chen K, Schmidt H, Kalicki-Veizer J, Magrini VJ, Cook L, McGrath SD, Vickery TL, Wendl MC, Heath S, Watson MA, Link DC, Tomasson MH, et al. Clonal evolution in relapsed acute myeloid leukaemia revealed by whole-genome sequencing. Nature. 2012;481:506–510. doi: 10.1038/nature10738. - DOI - PMC - PubMed
-
- Yan H, Parsons DW, Jin G, McLendon R, Rasheed BA, Yuan W, Kos I, Batinic-Haberle I, Jones S, Riggins GJ, Friedman H, Friedman A, Reardon D, Herndon J, Kinzler KW, Velculescu VE, Vogelstein B, Bigner DD. IDH1 and IDH2 mutations in gliomas. N Engl J Med. 2009;360:765–773. doi: 10.1056/NEJMoa0808710. - DOI - PMC - PubMed
-
- Russler-Germain DA, Spencer DH, Young MA, Lamprecht TL, Miller CA, Fulton R, Meyer MR, Erdmann-Gilmore P, Townsend RR, Wilson RK, Ley TJ. The R882H DNMT3A mutation associated with AML dominantly inhibits wild-type DNMT3A by blocking its ability to form active tetramers. Cancer Cell. 2014;25:442–454. doi: 10.1016/j.ccr.2014.02.010. - DOI - PMC - PubMed
-
- Landan G, Cohen NM, Mukamel Z, Bar A, Molchadsky A, Brosh R, Horn-Saban S, Zalcenstein DA, Goldfinger N, Zundelevich A, Gal-Yam EN, Rotter V, Tanay A. Epigenetic polymorphism and the stochastic formation of differentially methylated regions in normal and cancerous tissues. Nat Genet. 2012;44:1207–1214. doi: 10.1038/ng.2442. - DOI - PubMed
-
- Akalin A, Garrett-Bakelman FE, Kormaksson M, Busuttil J, Zhang L, Khrebtukova I, Milne TA, Huang Y, Biswas D, Hess JL, Allis CD, Roeder RG, Valk PJ, Löwenberg B, Delwel R, Fernandez HF, Paietta E, Tallman MS, Schroth GP, Mason CE, Melnick A, Figueroa ME. Base-pair resolution DNA methylation sequencing reveals profoundly divergent epigenetic landscapes in acute myeloid leukemia. PLoS Genet. 2012;8:e1002781. doi: 10.1371/journal.pgen.1002781. - DOI - PMC - PubMed
Publication types
MeSH terms
Grants and funding
LinkOut - more resources
Full Text Sources
Other Literature Sources
Molecular Biology Databases
