

The changing epidemiology of myocardial infarction in Olmsted County, Minnesota, 1995-2012
- PMID: 25261010
- PMCID: PMC4306650
- DOI: 10.1016/j.amjmed.2014.09.012
The changing epidemiology of myocardial infarction in Olmsted County, Minnesota, 1995-2012
Abstract
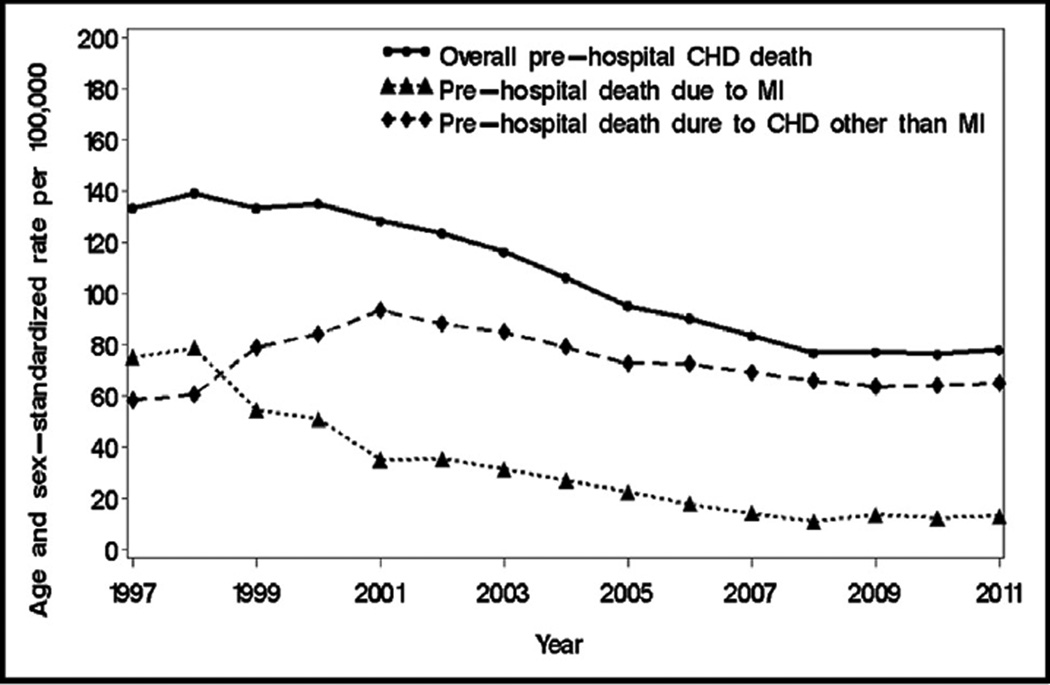
Background: Contemporary data on the epidemiology of myocardial infarction in the population are limited and derived primarily from cohorts of hospitalized myocardial infarction patients. We assessed temporal trends in incident and recurrent myocardial infarction, with further partitioning of the rates into prehospital deaths and hospitalized events, in a geographically defined community.
Methods: All myocardial infarction events recorded among Olmsted County, Minnesota residents aged 25 years and older from 1995-2012, including prehospital deaths, were classified into incident and recurrent. Standardized rates were calculated and temporal trends compared.
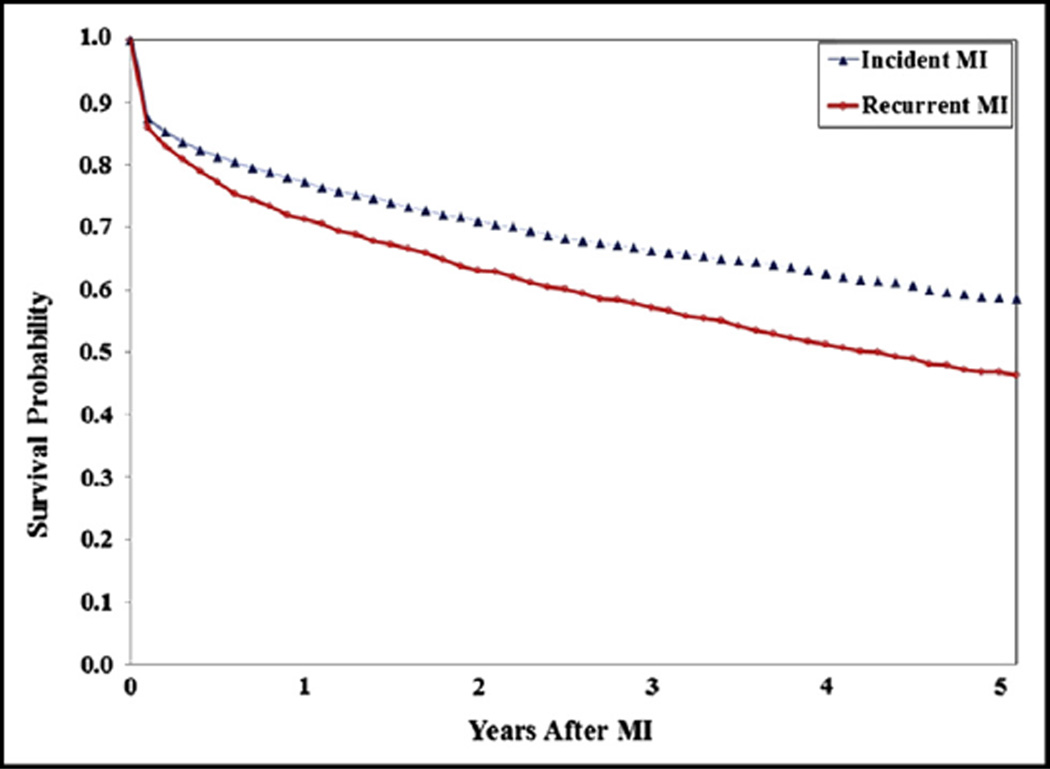
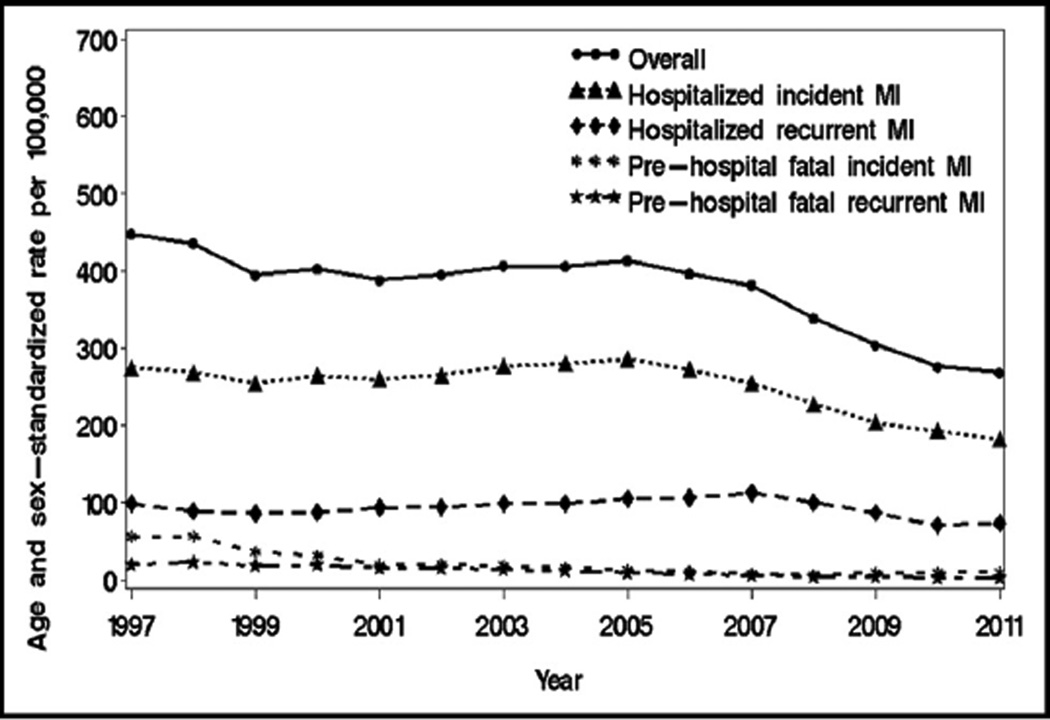
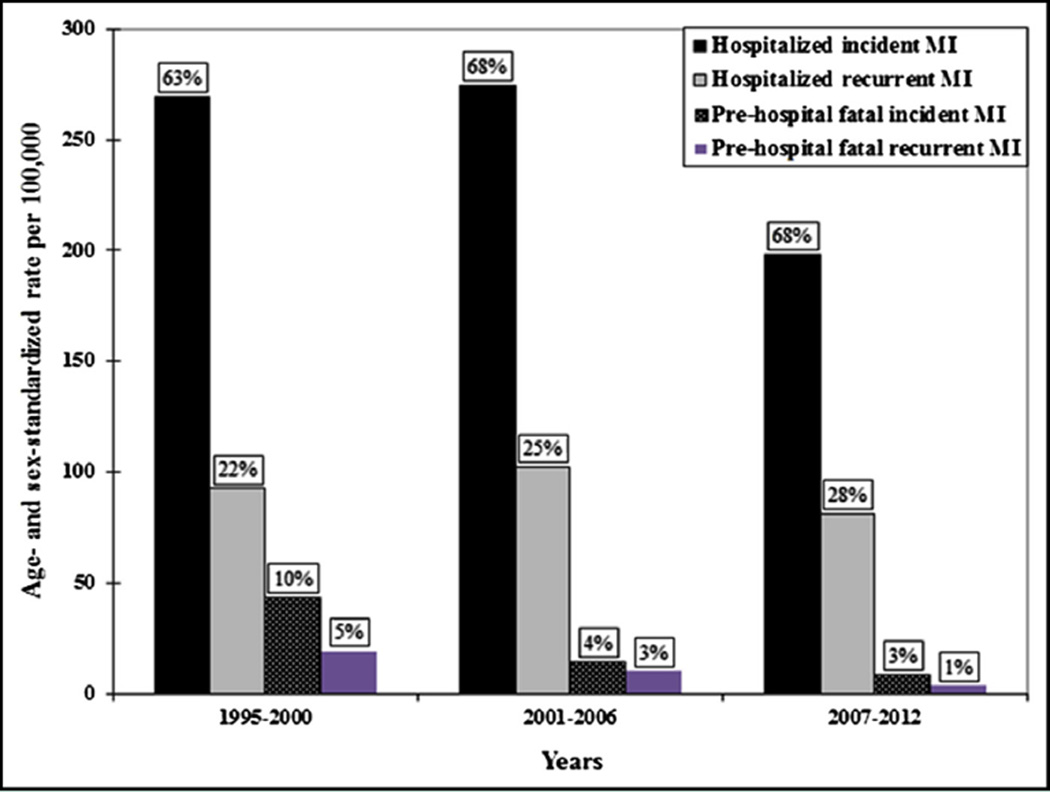
Results: Altogether, 5258 myocardial infarctions occurred, including 1448 (27.5%) recurrences; 430 (8.2%) prehospital deaths were recorded. Among hospitalized events, recurrent myocardial infarction was associated with greater mortality risk than incident myocardial infarction (age-, sex-, and year-adjusted hazard ratio, 1.49; 95% confidence interval, 1.37-1.61). Although the overall rate of myocardial infarction declined over time (average annual percent change, -3.3), the magnitude of the decline varied widely. Incident hospitalized myocardial infarction rate fell 2.7%/y, compared with decreases of 1.5%/y in recurrent hospitalized myocardial infarction, 14.1%/y in prehospital fatal incident myocardial infarction, and 12.3%/y in prehospital fatal recurrent myocardial infarction (all P for diverging trends < .05). These trends resulted in an increasing proportion of recurrences among hospitalized myocardial infarctions (25.3% in 1995-2000, 26.8% in 2001-2006, and 29.0% in 2007-2012, Ptrend = .02).
Conclusions: Over the past 18 years, a heterogeneous decline in myocardial infarction rates occurred in Olmsted County, resulting in transitions from incident to recurrent events and from prehospital deaths to hospitalized myocardial infarctions. Recurrent myocardial infarction confers a worse prognosis, thereby stressing the need to optimize prevention strategies in the population.
Keywords: Epidemiology; Myocardial infarction; Population; Prevention; Trends.
Copyright © 2015 Elsevier Inc. All rights reserved.
Conflict of interest statement
Figures
References
-
- Yeh RW, Sidney S, Chandra M, et al. Population trends in the incidence and outcomes of acute myocardial infarction. N Engl J Med. 2010;362:2155–2165. - PubMed
-
- From the Centers for Disease Control and Prevention. Public health and aging: trends in aging—United States and worldwide. JAMA. 2003;289:1371–1373. - PubMed
Publication types
MeSH terms
Grants and funding
LinkOut - more resources
Full Text Sources
Other Literature Sources
Medical
Miscellaneous
