. 2015 Jan;64(1):112-26.
doi: 10.1093/sysbio/syu080. Epub 2014 Sep 25.

Genomic repeat abundances contain phylogenetic signal

Affiliations

Genomic repeat abundances contain phylogenetic signal

Steven Dodsworth et al. Syst Biol. 2015 Jan.

Abstract

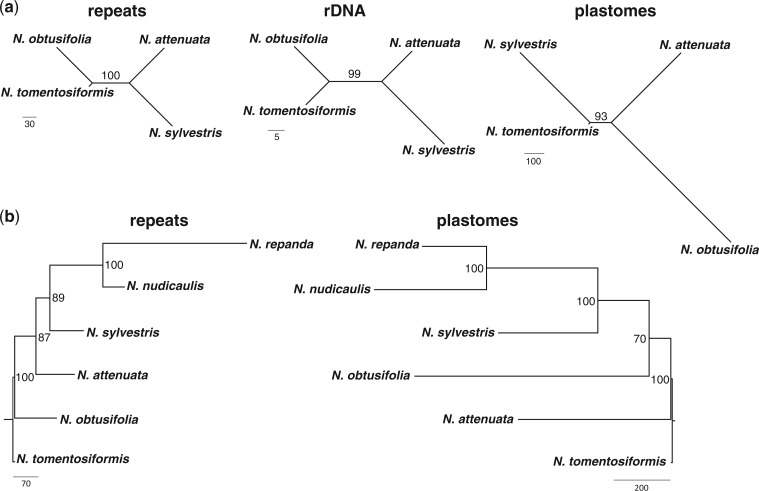
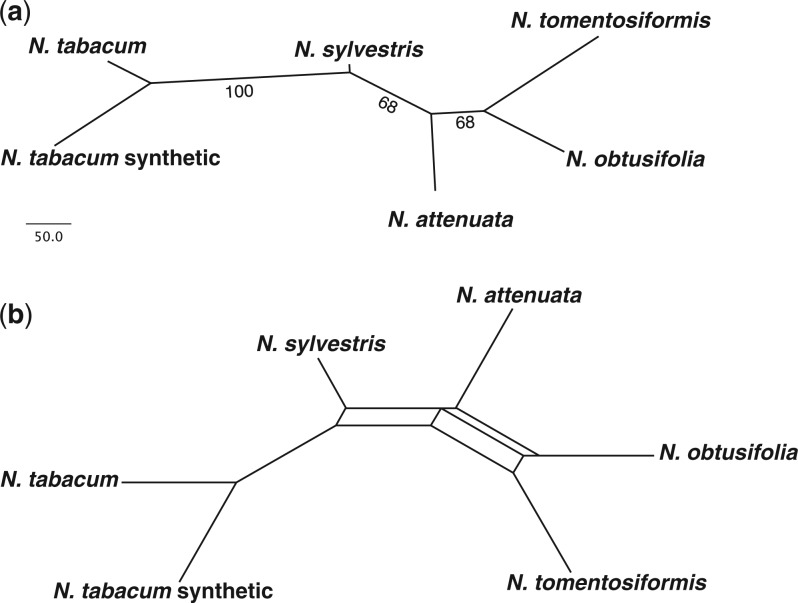
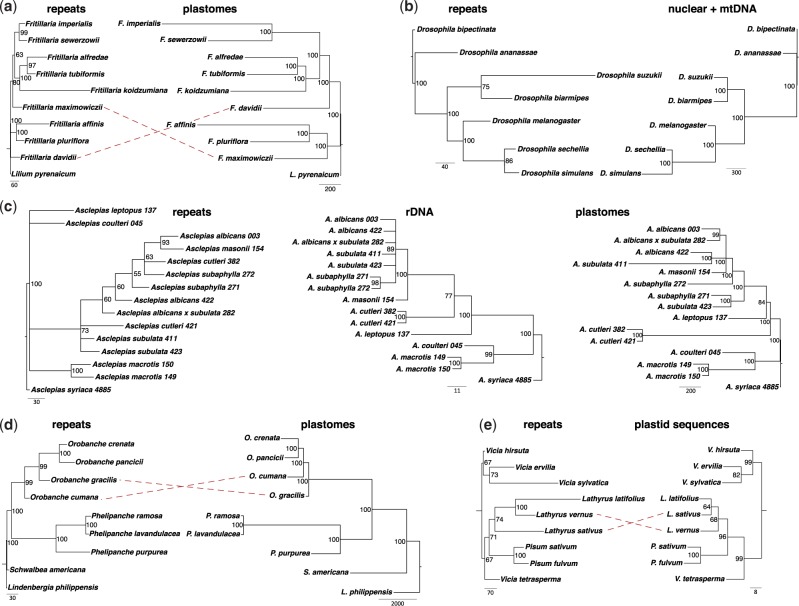
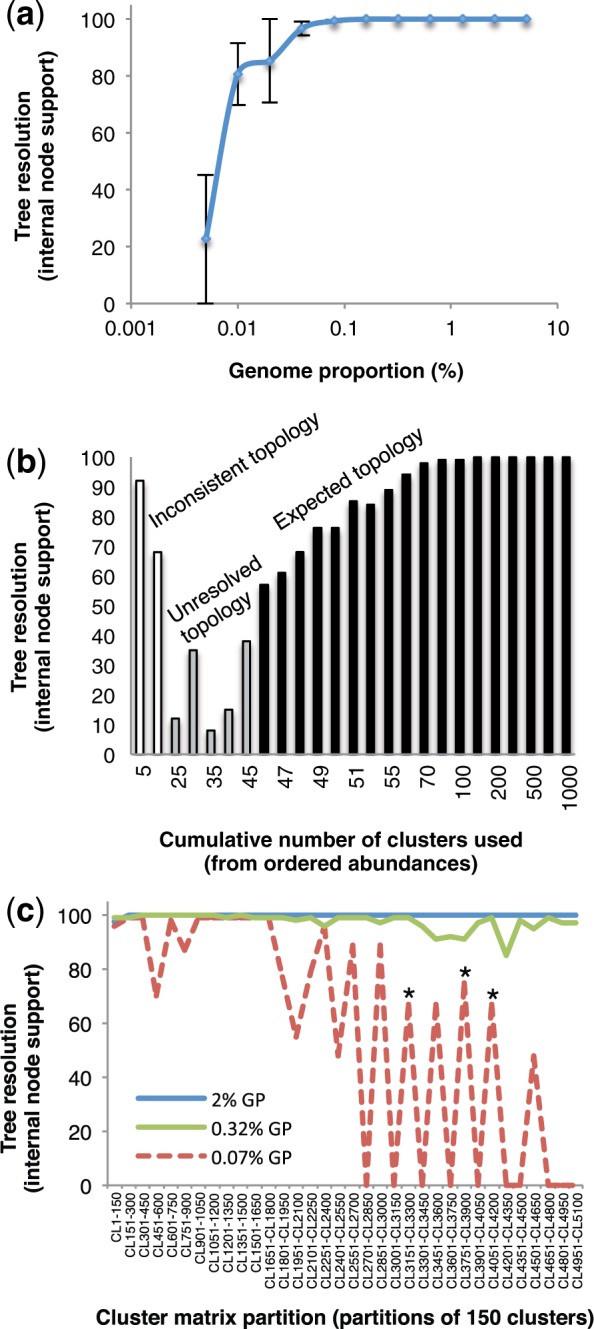
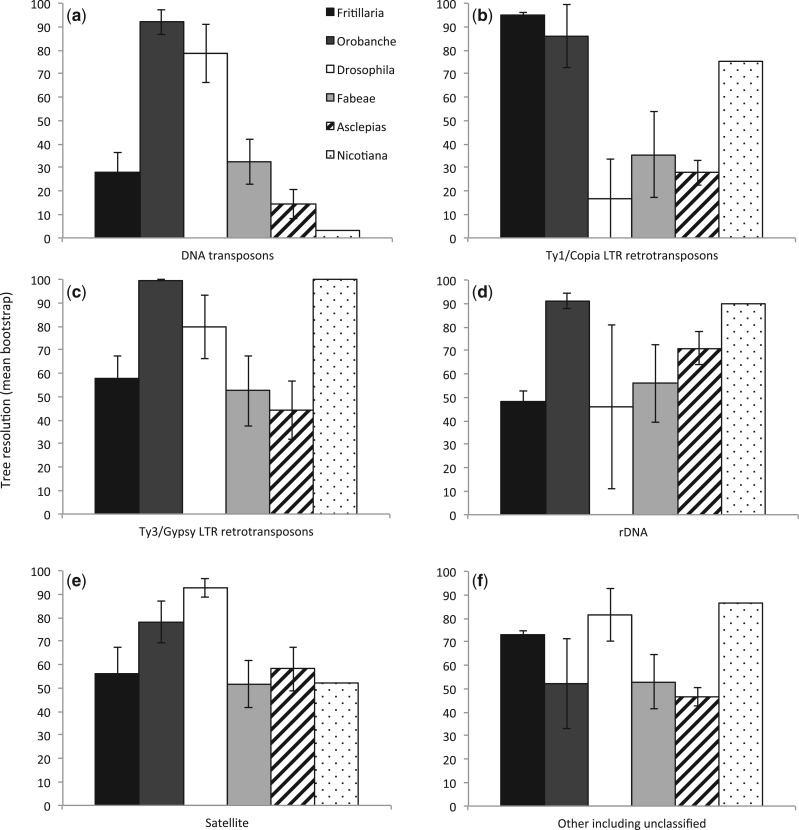
A large proportion of genomic information, particularly repetitive elements, is usually ignored when researchers are using next-generation sequencing. Here we demonstrate the usefulness of this repetitive fraction in phylogenetic analyses, utilizing comparative graph-based clustering of next-generation sequence reads, which results in abundance estimates of different classes of genomic repeats. Phylogenetic trees are then inferred based on the genome-wide abundance of different repeat types treated as continuously varying characters; such repeats are scattered across chromosomes and in angiosperms can constitute a majority of nuclear genomic DNA. In six diverse examples, five angiosperms and one insect, this method provides generally well-supported relationships at interspecific and intergeneric levels that agree with results from more standard phylogenetic analyses of commonly used markers. We propose that this methodology may prove especially useful in groups where there is little genetic differentiation in standard phylogenetic markers. At the same time as providing data for phylogenetic inference, this method additionally yields a wealth of data for comparative studies of genome evolution.

Keywords: Repetitive DNA; continuous characters; genomics; molecular systematics; next-generation sequencing; phylogenetics.


Figures

F<sc>igure</sc> 1.
Figure 1.
Phylogenetic relationships in Nicotiana (Solanaceae). a) Unrooted most parsimonious trees for repeats, large rDNA subunit sequences, and plastome sequences for four diploid Nicotiana taxa. b) Repeat and plastome trees including diploids from a) and Nicotiana section Repandae (N. nudicaulis and N. repanda). Repeat trees are based on 1000 cluster abundances from 5% genome proportion clustering. Maximum parsimony analysis with 10 000 symmetric bootstrap replications and bootstrap percentages plotted onto the single most parsimonious tree in each case. Numbers on nodes represent BPs50; branch lengths are shown from the single MPT and scale bars at the bottom left and right show relative numbers of step changes.
F<sc>igure</sc> 2.
Figure 2.
Phylogenetic relationships in a young allopolyploid, Nicotiana section Nicotiana (N. tabacum) and related diploid progenitor taxa (Solanaceae). a) Unrooted most parsimonious tree for repeats based on 1000 cluster abundances from 5% genome proportion clustering, maximum parsimony analysis with 10 000 symmetric bootstrap replications and bootstrap percentages plotted onto the single MPT. b) Filtered supernetwork showing relationships present in 10% of the bootstrap trees from a). Numbers on nodes represent BPs50; branch lengths are shown from the single MPT. The supernetwork is presented in order to present conflicting splits present due to recent reticulation.
F<sc>igure</sc> 3.
Figure 3.
Phylogenetic relationships in: a) Fritillaria (Liliaceae). Trees for repeats and plastome sequences are shown; repeat tree based on 1000 cluster abundances from 0.01% genome proportion clustering. b) Drosophila, the melanogaster species group (Drosophilidae). Trees for repeats and combined matrix of 17 nuclear and mitochondrial genes (see methods for full details); repeat tree based on 1000 cluster abundances from 5% genome proportion clustering. c) The Sonoran Desert clade of Asclepias (Apocynaceae). Trees for repeats, 26S to 18S complete rDNA cistron sequences and plastome sequences are shown; repeat tree based on 1000 cluster abundances from 2% genome proportion clustering (assuming the same genome size of 420 MBp in each—see methods). d) Orobanchaceae. Repeat tree and plastome tree shown; repeat tree based on 290 cluster abundances from 2% genome proportion clustering. e) Fabeae (Fabaceae). Repeat tree and tree based on combined plastid trnL/nuclear ITS shown; repeat tree based on 1000 cluster abundances from 1% genome proportion clustering. Maximum parsimony analysis with 10 000 symmetric bootstrap replications and bootstrap percentages plotted onto the single most parsimonious tree in each case. Numbers on nodes represent BPs50; branch lengths are shown from the single MPT and scale bars at the bottom left and right show relative numbers of changes. Dashed lines show instances of incongruence between repeat trees and DNA sequence trees.
F<sc>igure</sc> 4.
Figure 4.
Performance measures using the four-taxon diploid Nicotiana dataset. a) Analysis of genome proportion (GP%) vs. tree support as the symmetric bootstrap of the unrooted tree. b) Analysis of total number of clusters used vs. tree support as the symmetric bootstrap. c) Partition analysis of 150-cluster segments of the dataset at three levels of GP: 2%, 0.32%, and 0.07%. Asterisks in c) represent trees that contain inconsistent species groupings.
F<sc>igure</sc> 5.
Figure 5.
Impact of repeat type on tree resolution and method performance. Informativeness of each repeat type was estimated by creating subsets of the original matrices based on repeat annotation; in each case the mean bootstrap was calculated for each repeat type and each taxon dataset, error bars represent the standard error. a) DNA transposons. b) Ty1/Copia LTR retrotransposons. c) Ty3/Gypsy LTR retrotransposons. d) rDNA. e) Satellites. f) Other repeats including unclassified repeats and nonLTR retrotransposons.

References

    1. Angiosperm Phylogeny Group. An update of the Angiosperm Phylogeny Group classification for the orders and families of flowering plants: APG III. Bot. J. Linn. Soc. 2009;161:105–121.
    1. Ambrozova K., Mandakova T., Bures P., Neumann P., Leitch I.J., Koblizkova A., Macas J., Lysak M.A. Diverse retrotransposon families and an AT-rich satellite DNA revealed in giant genomes of Fritillaria lilies. Ann. Bot. 2011;107:255–268. - PMC - PubMed
    1. Bai C., Alverson W.S., Follansbee A., Waller D.M. New reports of nuclear DNA content for 407 vascular plant taxa from the United States. Ann. Bot. 2012;110:1623–1629. - PMC - PubMed
    1. Barrett C.F., Davis J.I., Leebens-Mack J., Conran J.G., Stevenson D.W. Plastid genomes and deep relationships among the commelinid monocot angiosperms. Cladistics. 2013;29:65–87. - PubMed
    1. Bock D.G., Kane N.C., Ebert D.P., Rieseberg L.H. Genome skimming reveals the origin of the Jerusalem Artichoke tuber crop species: neither from Jerusalem nor an artichoke. New Phyt. 2014;201:1021–1030. - PubMed

Publication types