. 2014 Nov 1;193(9):4477-84.
doi: 10.4049/jimmunol.1401558. Epub 2014 Sep 26.

mTORC1-dependent metabolic reprogramming is a prerequisite for NK cell effector function

Affiliations

mTORC1-dependent metabolic reprogramming is a prerequisite for NK cell effector function

Raymond P Donnelly et al. J Immunol. .

Abstract

The mammalian target of rapamycin complex 1 (mTORC1) is a key regulator of cellular metabolism and also has fundamental roles in controlling immune responses. Emerging evidence suggests that these two functions of mTORC1 are integrally linked. However, little is known regarding mTORC1 function in controlling the metabolism and function of NK cells, lymphocytes that play key roles in antiviral and antitumor immunity. This study investigated the hypothesis that mTORC1-controlled metabolism underpins normal NK cell proinflammatory function. We demonstrate that mTORC1 is robustly stimulated in NK cells activated in vivo and in vitro. This mTORC1 activity is required for the production of the key NK cell effector molecules IFN-γ, which is important in delivering antimicrobial and immunoregulatory functions, and granzyme B, a critical component of NK cell cytotoxic granules. The data reveal that NK cells undergo dramatic metabolic reprogramming upon activation, upregulating rates of glucose uptake and glycolysis, and that mTORC1 activity is essential for attaining this elevated glycolytic state. Directly limiting the rate of glycolysis is sufficient to inhibit IFN-γ production and granzyme B expression. This study provides the highly novel insight that mTORC1-mediated metabolic reprogramming of NK cells is a prerequisite for the acquisition of normal effector functions.


Figures

Figure 1
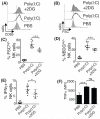
Figure 1. mTORC1 activity is required for IFNγ production in NK cells in vivo
(A-E) Mice were administered PBS, 200 μg poly(I:C) alone or in combination with rapamycin (0.6 mg/kg) by peritoneal injection. (A-B) Spleens were harvested after 12 hours or 24 hours and NKp46+ TCRβ− NK cells (A-B) or TCRβ+ T cells (A) analysed by flow cytometry for levels of phospho-S6 ribosomal protein (pS6). (C-G) Spleens were harvested after 24 hours for analysis. NK1.1+ NKp46+ CD3− NK cells were analysed by flow cytometry for CD69 expression (C), IFNγ production (D-E), and TNFα expression (F-G). (H-J) Splenocytes were stimulated ex vivo with poly(I:C) +/− IL2/12 +/− rapamcyin or left untreated for 18 hours and IFNγ production, frequency and MFI, was analysed in NK1.1+ NKp46+ CD3− cells. Data is mean +/− S.E.M or representative of 5-10 mice for each condition from 2 separate experiments (A-E), 4 mice for each condition (F-G), 3 separate experiments (H-J) (ns, non significant, * p<0.05, **p<0.001, ***p<0.001).
Figure 2
Figure 2. Rapamycin treatment prevents normal blastogenesis of NK cells activated in vivo by poly(I:C)
(A-E) Mice were administered PBS, 200 μg poly(I:C) alone or in combination with rapamycin (0.6 mg/kg) by peritoneal injection and spleens harvested after 24 hours. Splenocytes were isolated and NK1.1+ NKp46+ CD3− NK cells (or NK1.1+ NKp46+ TCRβ− NK cells for NBDG experiments) analysed by flow cytometry. The forward scatter of NK cells was compared for IFNγ-positive versus IFNγ-negative NK cells from poly(I:C)-treated mice (A). Differences in NK cell size (B) and the frequency of FSChigh NK cells (C) in each treatment group were analysed. (D) Poly(I:C)-stimulated NK cells were segregated based on cell size (left) and small versus large NK cells analysed for levels of glucose uptake (NBDG), CD98 and CD71 expression (right). (E) Analysis of the frequency of NK cells with high levels of NBDG, and expression of CD71 and CD98. Data is mean +/− S.E.M or representative of 8-10 mice for each condition from 2 separate experiments. (**p<0.01, ***p<0.001).
Figure 3
Figure 3. mTORC1 is required for metabolic reprogramming of activated NK cells
Analysis of the rate of glycolysis (ECAR) (A), CD25 expression (B), mTORC1 activity as measured by pS6 levels (C), glucose uptake (NBDG) (D) and OxPhos (OCR) (E) in cultured NK cells stimulated for 18 hours with IL2, IL12, IL2 plus IL12 or left unstimulated. (F) Ratio of glucose utilization for glycolysis to OxPhos in NK cells stimulated with IL2/12 or left unstimulated or 18 hours. (G-I) Cultured NK cells were stimulated for 18 hours with IL2/12 +/− rapamcyin (20 nM) or left unstimulated and analysed for the rates of glycolysis (G) and OxPhos (H) and the expression of Glut1, Hex2 and Ldha mRNA (I). (J) Immunoblot analysis of cultured NK cells stimulated with IL2/12 for 18 hours +/− rapamycin (20 nM), +/− AZD-8055 (1 μM). Data is mean +/− S.E.M or representative of 3-5 experiments. (ns, non significant, * p<0.05, ** p<0.01, ***p<0.001).
Figure 4
Figure 4. Elevated rates of glycolysis are required for normal NK cell effector functions
(A-B) Cultured NK cells either unstimulated or treated with IL2/12 +/− rapamycin for 18 hours were analysed by flow cytometry for IFNγ and granzyme B (Gnzb) expression in NK1.1+ NKp46+ CD3− NK cells. (C-D) Cultured NK cells either unstimulated or treated with IL2/12 +/− 2-deoxyglucose (2DG) at the stated concentrations for 18 hours were analysed by flow cytometry for CD69 (C), IFNγ and Gnzb (C-D) expression in NK1.1+ NKp46+ CD3− NK cells. (E-G) Cultured NK cells either unstimulated in media containing 10 mM glucose or treated with IL2/12 in media containing glucose (10 mM) or galactose (10 mM) for 18 hours were analysed; for rates of glycolysis and OxPhos (E); and by flow cytometry for levels of CD69 (F), and IFNγ, Gnzb (F-G) and pS6 (H), in NK1.1+ NKp46+ CD3− NK cells. Data is mean +/− S.E.M or representative of 3-5 experiments (A-D, F-G), 8 replicates from 2 separate experiments (E) or 3 separate experiments (H). (ns, non significant, * p<0.05, ** p<0.01, ***p<0.001).
Figure 5
Figure 5. Elevated NK cell glycolysis is required for maximal IFNγ protein expression
(A) IL2/12-stimulated cultured NK cells were treated +/− rapamycin, +/− 2DG, in the presence of glucose versus galactose as in figure 4. The data show the relative levels of IFNγ MFI in NK cells with decreased levels of glycolysis compared to the relevant IL2/12 control (dotted line). (B) IFNγ mRNA expression in cultured NK cells unstimulated or stimulated with IL2/12 +/− rapamycin for 18 hours. (C) Rate of glycolysis (ECAR) in cultured NK cells stimulated with IL2/12 plus rapamycin before and after the inhibition of ATP synthase with the addition of oligomycin (2 μM). (D) Cultured NK cells were activated with IL2/12 for 18 hours +/− rapamcyin or activated with IL2/12 for 14 hours before the addition of oligomycin added for 5 hours. Data is mean +/− S.E.M 4-12 experiments (A), 3 experiments (B-D) (ns, non significant, * p<0.05, ***p<0.001).
Figure 6
Figure 6. Disruption of NK cell glycolysis in vivo inhibits NK cell growth and effector function
(A-F) Mice were administered PBS, 200 μg poly(I:C) alone or in combination with 2DG (1 g/kg) by peritoneal injection and spleens harvested after 24 hours. Splenocytes were isolated and NK1.1+ NKp46+ CD3− NK cells (or NK1.1+ NKp46+ TCRβ+ NK cells for NBDG experiments) were analysed for CD69 expression (A), cell size (B, C), glucose uptake (NBDG) (D), IFNγ (E) and TNFα production (F). All data mean +/− S.E.M or representative of 8-10 mice for each condition from 2 separate experiments. (ns, non significant, * p<0.05, ** p<0.01, ***p<0.001).

References

    1. Powell JD, Pollizzi KN, Heikamp EB, Horton MR. Regulation of immune responses by mTOR. Annu Rev Immunol. 2012;30:39–68. - PMC - PubMed
    1. Finlay DK, Rosenzweig E, Sinclair LV, Feijoo-Carnero C, Hukelmann JL, Rolf J, Panteleyev AA, Okkenhaug K, Cantrell DA. PDK1 regulation of mTOR and hypoxia-inducible factor 1 integrate metabolism and migration of CD8+ T cells. The Journal of experimental medicine. 2012;209:2441–2453. - PMC - PubMed
    1. Shi LZ, Wang R, Huang G, Vogel P, Neale G, Green DR, Chi H. HIF1alpha-dependent glycolytic pathway orchestrates a metabolic checkpoint for the differentiation of TH17 and Treg cells. The Journal of experimental medicine. 2011;208:1367–1376. - PMC - PubMed
    1. Kidani Y, Elsaesser H, Hock MB, Vergnes L, Williams KJ, Argus JP, Marbois BN, Komisopoulou E, Wilson EB, Osborne TF, Graeber TG, Reue K, Brooks DG, Bensinger SJ. Sterol regulatory element-binding proteins are essential for the metabolic programming of effector T cells and adaptive immunity. Nat Immunol. 2013;14:489–499. - PMC - PubMed
    1. Amiel E, Everts B, Freitas TC, King IL, Curtis JD, Pearce EL, Pearce EJ. Inhibition of mechanistic target of rapamycin promotes dendritic cell activation and enhances therapeutic autologous vaccination in mice. Journal of immunology. 2012;189:2151–2158. - PMC - PubMed

Publication types