. 2014 Oct 14;111(41):E4376-85.
doi: 10.1073/pnas.1411649111. Epub 2014 Sep 26.

Proteopathic tau seeding predicts tauopathy in vivo

Affiliations

Proteopathic tau seeding predicts tauopathy in vivo

Brandon B Holmes et al. Proc Natl Acad Sci U S A. .

Abstract

Transcellular propagation of protein aggregates, or proteopathic seeds, may drive the progression of neurodegenerative diseases in a prion-like manner. In tauopathies such as Alzheimer's disease, this model predicts that tau seeds propagate pathology through the brain via cell-cell transfer in neural networks. The critical role of tau seeding activity is untested, however. It is unknown whether seeding anticipates and correlates with subsequent development of pathology as predicted for a causal agent. One major limitation has been the lack of a robust assay to measure proteopathic seeding activity in biological specimens. We engineered an ultrasensitive, specific, and facile FRET-based flow cytometry biosensor assay based on expression of tau or synuclein fusions to CFP and YFP, and confirmed its sensitivity and specificity to tau (∼ 300 fM) and synuclein (∼ 300 pM) fibrils. This assay readily discriminates Alzheimer's disease vs. Huntington's disease and aged control brains. We then carried out a detailed time-course study in P301S tauopathy mice, comparing seeding activity versus histological markers of tau pathology, including MC1, AT8, PG5, and Thioflavin S. We detected robust seeding activity at 1.5 mo, >1 mo before the earliest histopathological stain. Proteopathic tau seeding is thus an early and robust marker of tauopathy, suggesting a proximal role for tau seeds in neurodegeneration.

Keywords: aging; amyloid; dementia; neuropathology.


Conflict of interest statement

The authors declare no conflict of interest.

Figures

Fig. 1.
Fig. 1.
FRET flow cytometry reliably detects tau seeding. (A) Schematic model of the FRET assay workflow. Lipofectamine/seed formulations are applied to biosensor cells for 24 h. Seeded aggregation produces a FRET signal that is measured by flow cytometry. (B) Confocal microscopy of tau biosensor cells transduced with liposome vehicle or tau seeds (1 nM). Tau seed-treated cells exhibit intracellular tau inclusions. (Scale bar, 20 µm.) (C) Recombinant tau RD seeds produce a dose-dependent FRET signal in the tau biosensor cells as measured by flow cytometry. (D) Recombinant α-synuclein seeds produce a dose-dependent FRET signal in the synuclein biosensor cells. Error bars show SEM; *P < 0.05; **P < 0.01; Student t test. The dashed line designates the concentration at which the Z′ score exceeds 0.5.
Fig. 2.
Fig. 2.
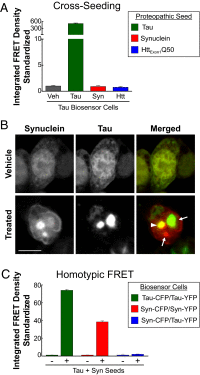
The tau biosensor cells are specific to tau seeds and homotypic interactions. (A) Cross-seeding experiments demonstrate that tau seeds alone produce a FRET response. Tau biosensor cells were separately transduced with 500 nM each of tau, synuclein, or Htt seeds for 24 h. Veh designates lipofectamine-only control. (B and C) Only homotypic biosensors score positive for FRET. Cells transiently transfected with tau-CFP/tau-YFP; synuclein-CFP/synuclein-YFP; or synuclein-CFP/tau-YFP were cotransduced with either 100 nM tau seeds + 100 nM synuclein seeds or lipofectamine alone. Confocal microscopy images show seed-treated heterotypic FRET biosensors (synuclein-CFP/tau-YFP). Arrows point to aggregates comprised of a single biosensor protein, either tau or synuclein; arrowhead points to an aggregate comprised of both tau and synuclein biosensors (B). (Scale bar, 10 μM.) Although all three biosensor cell lines displayed robust aggregation, FRET was only observed in the homotypic biosensor lines (C).
Fig. 3.
Fig. 3.
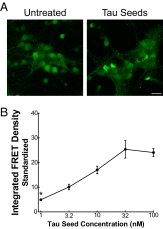
FRET flow cytometry detects physiological tau seeding in primary neurons. (A) Cultured mouse hippocampal neurons were transduced with lentivirus encoding tau P301S-CFP and tau P301S-YFP on day in vitro 0 and treated with 100 nM recombinant tau seeds in the absence of lipofectamine on day in vitro 4. Seventy-two hours later, neurons were imaged via confocal microscopy. (Scale bar, 20 µm.) (B) In the absence of lipofectamine, recombinant tau RD seeds produce a dose-dependent FRET signal in the lenti-expressing neurons as measured by FRET flow cytometry: 10,000 neurons per replicated well were analyzed; n = 4. Error bars show SEM; *P < 0.0001; Student t test.
Fig. 4.
Fig. 4.
Tau seeding activity is present in AD brains, but not aged, control brains, or HD brains. (A) Ten micrograms of clarified lysate [10% (wt/vol)] was transduced into HEK293T tau biosensor cells. After 24 h, cells were harvested for FRET flow cytometry. Tau seeding is detected in all AD brains and not in age-matched controls or HD brains. Confocal microscopy analysis of biosensor cells transduced with (B) AD or (C) HD brain homogenates. (Scale bar, 20 μM.) (D) Tau seeding activity is depleted with the anti-tau antibody, HJ8.5, but not the anti-Aβ antibody, HJ3.4. Error bars show SEM; *P < 0.05; one-way ANOVA.
Fig. 5.
Fig. 5.
Seeding activity is present in the brains of P301S transgenic mice and increases with age. Microdissected brainstem (A), neocortex (B), frontal lobe (C), and hippocampus (D) from the right hemisphere were homogenized and 1.5 µL of clarifed lysate [10% (wt/vol)] was transduced into the tau biosensor cells. After 24 h, the biosensor cells were harvested for FRET flow cytometry. Tau seeding is detected in the P301S mouse line as early as 1.5 mo and increases with age. A minimum of four mice were analyzed per age group and all lysates were run in quadruplicate. Individual data points depict individual mice. Error bars show SEM; **P = 0.0004, Mann–Whitney U test, two-tailed exact significance; n.s., not significant.
Fig. 6.
Fig. 6.
MC1 staining shows aberrant tau deposition at 3 mo. (A) Representative images from P301S transgenic animals at different ages, stained with MC1. (Scale bar, 0.5 mm.) (B) High-power images of the neocortex from the same brain sections shown in A. Weak staining can be seen in 3-mo-old animals, and stronger cell body staining can be seen in 6-mo-old animals. (Scale bar, 100 µm.) (C and D) Percent area covered by MC1 staining in the neocortex (C), and hippocampus (D). Note the age-dependent increase in MC1 signal for both regions. Error bars show SEM. Neocortex: *P = 0.0074; Hippocampus: *P = 0.0091; Mann–Whitney U test, two-tailed exact significance.
Fig. 7.
Fig. 7.
AT8 staining shows phospho-tau deposition at 6 mo. (A) Representative images from P301S transgenic animals at different ages, stained with AT8. (Scale bar, 0.5 mm.) (B) High-power images of neocortex from the same brain sections shown in A. Cell body staining begins at 6 mo. (Scale bar, 100 µm.) (C and D) Percent area covered by AT8 staining of phospho-tau in the neocortex (C), and hippocampus (D). Note the age-dependent increase in AT8 signal for both regions with signal becoming reliably positive at 6 mo. Error bars show SEM. Neocortex: *P = 0.040, **P = 0.025; Hippocampus: *P = 0.013, **P = 0.004; Mann–Whitney U test, two-tailed exact significance.
Fig. 8.
Fig. 8.
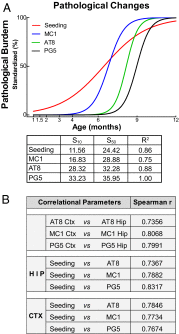
Tau seeding activity precedes other markers of tauopathy. (A) Tau seeding, MC1, AT8, and PG5 timecourse data were modeled using nonlinear regression analysis. The S10 and S50 was calculated for each parameter, represented in weeks. Tau seeding precedes other histopathological markers by more than 4 wk. Thioflavin S was not included because of its nonscalar ranking system. (B) Correlation analysis was conducted between different brain regions using the same antibody and between seeding activity and staining within the same brain regions. Seeding activity correlates well with AT8, MC1, and PG5 staining.

References

    1. Seeley WW, Crawford RK, Zhou J, Miller BL, Greicius MD. Neurodegenerative diseases target large-scale human brain networks. Neuron. 2009;62(1):42–52. - PMC - PubMed
    1. Zhou J, Gennatas ED, Kramer JH, Miller BL, Seeley WW. Predicting regional neurodegeneration from the healthy brain functional connectome. Neuron. 2012;73(6):1216–1227. - PMC - PubMed
    1. Raj A, Kuceyeski A, Weiner M. A network diffusion model of disease progression in dementia. Neuron. 2012;73(6):1204–1215. - PMC - PubMed
    1. Braak H, Braak E. Neuropathological stageing of Alzheimer-related changes. Acta Neuropathol. 1991;82(4):239–259. - PubMed
    1. Braak H, Braak E. Staging of Alzheimer’s disease-related neurofibrillary changes. Neurobiol Aging. 1995;16(3):271–278, discussion 278–284. - PubMed

Publication types

MeSH terms