Case Reports
. 2014 Nov;46(11):1239-44.
doi: 10.1038/ng.3103. Epub 2014 Sep 28.

Mutations in SPRTN cause early onset hepatocellular carcinoma, genomic instability and progeroid features

Affiliations
Case Reports

Mutations in SPRTN cause early onset hepatocellular carcinoma, genomic instability and progeroid features

Davor Lessel et al. Nat Genet. 2014 Nov.

Abstract

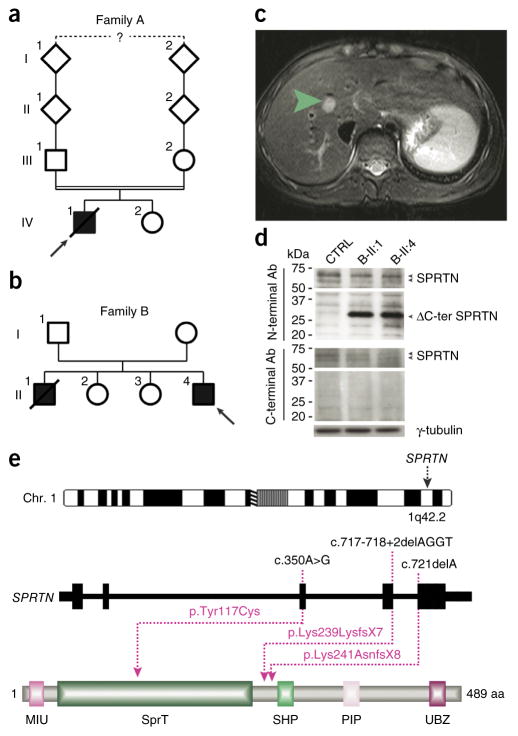
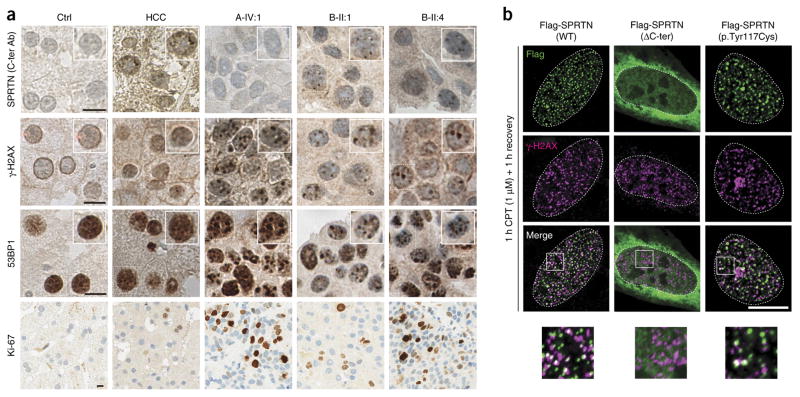
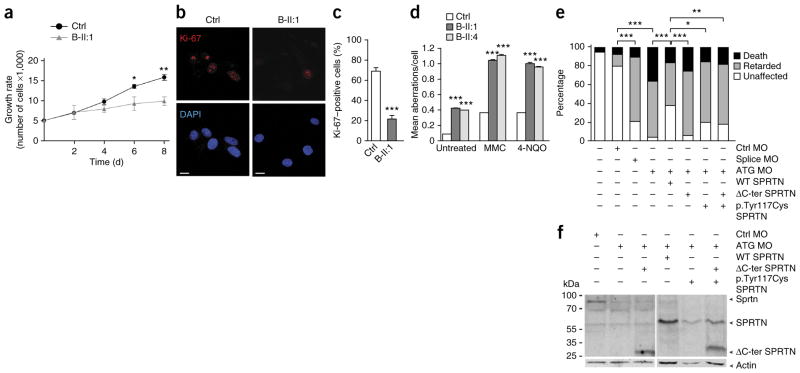
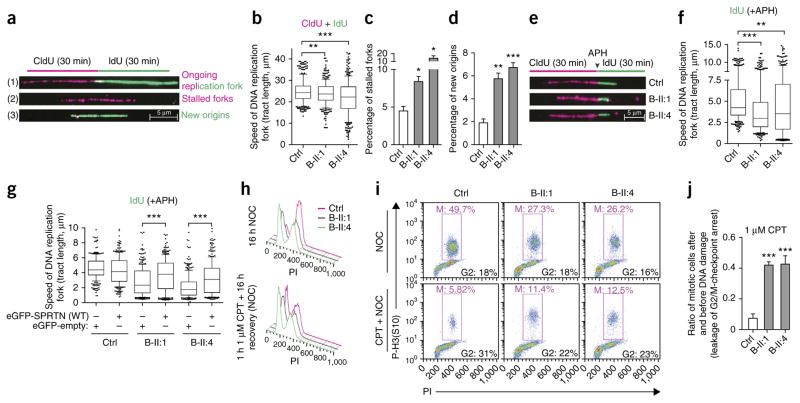
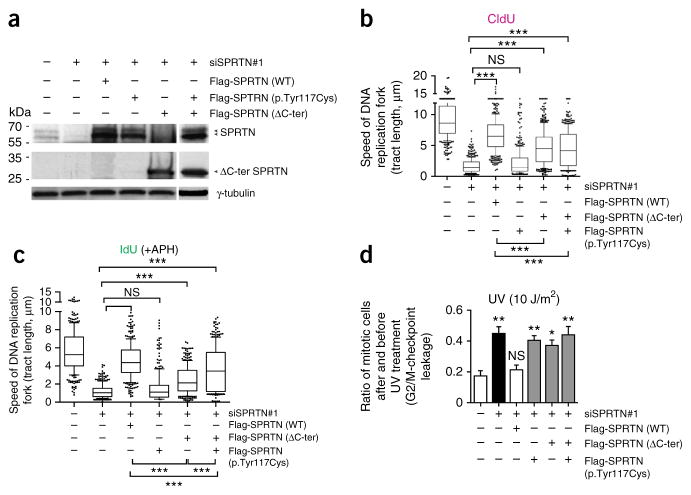
Age-related degenerative and malignant diseases represent major challenges for health care systems. Elucidation of the molecular mechanisms underlying carcinogenesis and age-associated pathologies is thus of growing biomedical relevance. We identified biallelic germline mutations in SPRTN (also called C1orf124 or DVC1) in three patients from two unrelated families. All three patients are affected by a new segmental progeroid syndrome characterized by genomic instability and susceptibility toward early onset hepatocellular carcinoma. SPRTN was recently proposed to have a function in translesional DNA synthesis and the prevention of mutagenesis. Our in vivo and in vitro characterization of identified mutations has uncovered an essential role for SPRTN in the prevention of DNA replication stress during general DNA replication and in replication-related G2/M-checkpoint regulation. In addition to demonstrating the pathogenicity of identified SPRTN mutations, our findings provide a molecular explanation of how SPRTN dysfunction causes accelerated aging and susceptibility toward carcinoma.


Conflict of interest statement

COMPETING FINANCIAL INTERESTS

The authors declare no competing financial interests.

Figures

Figure 1
Figure 1
Identification of causative SPRTN mutations. (a,b) The pedigrees of families A and B. Filled and open symbols denote affected and healthy individuals, respectively; an arrow indicates the index patient, and diagonal lines indicate deceased status. The double line shows parental consanguinity, and the question mark denotes that the exact degree of consanguinity is unknown. (c) Axial view of magnetic resonance imaging of the liver of patient B-II:4. The green arrow indicates a 12 mm × 13 mm lesion mass with an absence of arterial phase enhancement within segment VIII of the liver that was subsequently shown to be a HCC. (d) Analysis of total cell extracts of patients’ LCLs with SPRTN antibodies (Ab) raised against the N- or C-terminal part of the protein. (e) Genomic localization and protein structure of SPRTN. The genomic structure is based on the longest ORF containing five coding exons (black rectangles). The positions of the identified mutations are shown at both the gene (top) and protein (bottom) levels. The protein diagram depicts the predicted functional domains of SPRTN. aa, amino acids.
Figure 2
Figure 2
Severe DNA damage in hepatocellular carcinoma biopsies and focal nuclear accumulation of SPRTN. (a) Histological and immunohistochemical analyses of human liver biopsies from a healthy control (Ctrl), a patient with idiopathic, non–viral caused HCC and the HCC of patients with SPRTN mutations (A-IV:1, B-II:1 and B-II:4). The samples were stained with antibody raised against the C-terminal part of SPRTN (C-ter Ab) or with antibodies against γ-H2AX, 53BP1 or Ki-67. The insets in the top three rows are at 1.25× magnification. (b) U2OS cells were transiently transfected with Flag-tagged WT or mutant SPRTN and challenged with 1 μM of CPT to induce replication-related DSBs and thus mimic the DNA damage observed in patients’ livers. The images at the bottom of b are 3× magnified versions of the boxed areas in the merged images above. Scale bars, 10 μm (a,b).
Figure 3
Figure 3
Genomic instability and cell proliferation defects. (a) A growth curve of control and patient primary skin fibroblasts. The data are from three independent experiments. (b) Primary skin fibroblasts stained with the proliferation marker Ki-67. Scale bars, 10 μm. DAPI, 4′,6-diamidino-2- phenylindole. (c) Quantification of the data in b. The data are from three independent experiments with greater than 100 cells scored per condition per experiment. (d) Chromosomal aberrations in patients’ LCLs under untreated conditions or the following genotoxic conditions: 40 ng/ml of MMC or 200 ng/ml of 4-NQO. The data are from three independent experiments with 33 analyzed metaphase cells per condition per experiment. The data in a, c and d were analyzed with unpaired t-test and are presented as the mean ± s.e.m. (e) Morpholino oligonucleotide (MO)-mediated gene downregulation of Sprtn in zebrafish at 10 hpf and a rescue experiment with human WT SPRTN or SPRTN harboring the two patient mutations. Ctrl MO denotes embryos injected with control MO, ATG MO denotes embryos injected with SPRTN MO targeting the start codon, and splice MO denotes embryos injected with a splice-site MO. The bar graph summarizes analyses in more than 100 embryos in three independent experiments showing the distribution of phenotypes observed after injections with 17.6 ng of MO and co-injections of 100 pg of SPRTN mRNA. P values in e were calculated using the χ2 test. *P < 0.01, **P < 0.001, ***P < 0.0001 (a,ce). (f) Western blot analysis of the experiment shown in e. Sprtn, endogenous zebrafish protein; SPRTN, ectopically expressed human protein.
Figure 4
Figure 4
DNA replication stress and leakage of the G2/M cell cycle checkpoint as the origin of genomic instability. (a) Schematic representation of a single DNA replication fork analysis by DNA fiber assay and its outcome ((1)–(3)). (bd) DNA replication forks, as described in a, were analyzed in LCLs and quantified for velocity (b), percentage of stalled forks (c) and percentage of newly fired replication origins (d). n = 3; 100 CldU (5-chloro-2′-deoxyuridine) and 100 IdU (5-iodo-2′-deoxyuridine) symmetrical tracts were individually quantified, counted and are presented as total tract length (b), or 400 forks were randomly scored per condition per experiments (c,d). (e) Representative replication forks analyzed in LCLs when the incorporation of IdU was in the presence of a low dose of APH (0.1 μM). (f) The speed of replication forks under mild genotoxic conditions (IdU only). n = 3; 100 DNA fibers analyzed per experiment per condition. (g) LCLs were transfected with WT SPRTN, and the speed of replication fork was measured under mild genotoxic conditions, as in e. n = 2; 100 DNA fibers analyzed per experiment per condition. (h) Cell cycle profile of LCLs. NOC, nocodazole. PI, propidium iodide. (i) Mitotic (red triangle) LCLs without and with CPT treatment analyzed in the presence of NOC. (j) Quantification of i; n = 3. Data in b, f and g are shown as the median (bar) with the 25th–75th percentile range (box) and the 10th–90th percentile range (whiskers). Data in c, d and j are shown as the mean ± s.e.m. Data in bd, f, g and j were analyzed with unpaired two-tailed t-test. *P < 0.0), **P < 0.001, ***P < 0.0001.
Figure 5
Figure 5
Characterization of patients’ mutations in DNA replication and G2/M-checkpoint regulation. (a) Western blot analysis of U2OS cells depleted of endogenous SPRTN by siRNA (siSPRTN#1) and simultaneously expressing siRNA-resistant WT SPRTN, ΔC-ter SPRTN or p.Tyr117Cys SPRTN or coexpressing of ΔC-ter SPRTN and p.Tyr117Cys SPRTN. (b,c) U2OS cells, as in a, labeled with CldU for 30 min (unchallenged conditions; b) or with IdU and treated with APH for 30 min (mild genotoxic conditions; c) were analyzed by DNA fiber assay. 1 μm of DNA tract length corresponds to 2.6 kb of newly synthesized DNA. n = 3; more than 100 DNA fibers analyzed per experiment and per condition. (d) U2OS cells, as in a, were analyzed for the efficacy of the G2/M checkpoint after treatment with UV radiation, as described in Figure 4. The graph summarizes three independent experiments. The data in b and c are presented as the median (bar) with the 25th–75th percentile range (box) and the 10th–90th percentile range (whiskers). Data in d are shown as a bar graph with the mean ± s.e.m. Data in bd were analyzed with unpaired two-tailed t-test. *P < 0.05, **P < 0.001, ***P < 0.0001. NS, no significant difference between the groups.

Comment in

References

    1. Centore RC, Yazinski SA, Tse A, Zou L. Spartan/C1orf124, a reader of PCNA ubiquitylation and a regulator of UV-induced DNA damage response. Mol Cell. 2012;46:625–635. - PMC - PubMed
    1. Davis EJ, et al. DVC1 (C1orf124) recruits the p97 protein segregase to sites of DNA damage. Nat Struct Mol Biol. 2012;19:1093–1100. - PubMed
    1. Mosbech A, et al. DVC1 (C1orf124) is a DNA damage–targeting p97 adaptor that promotes ubiquitin-dependent responses to replication blocks. Nat Struct Mol Biol. 2012;19:1084–1092. - PubMed
    1. Juhasz S, et al. Characterization of human Spartan/C1orf124, an ubiquitin-PCNA interacting regulator of DNA damage tolerance. Nucleic Acids Res. 2012;40:10795–10808. - PMC - PubMed
    1. Kim MS, et al. Regulation of error-prone translesion synthesis by Spartan/C1orf124. Nucleic Acids Res. 2013;41:1661–1668. - PMC - PubMed

Publication types

MeSH terms