. 2014 Nov;46(11):1160-5.
doi: 10.1038/ng.3101. Epub 2014 Sep 28.

Genome-wide analysis of noncoding regulatory mutations in cancer

Affiliations

Genome-wide analysis of noncoding regulatory mutations in cancer

Nils Weinhold et al. Nat Genet. 2014 Nov.

Abstract

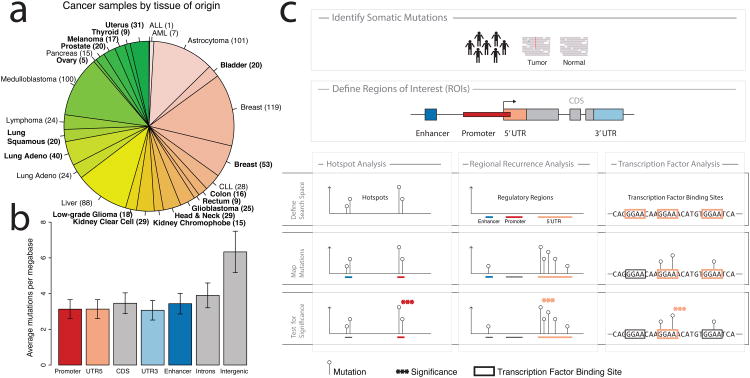
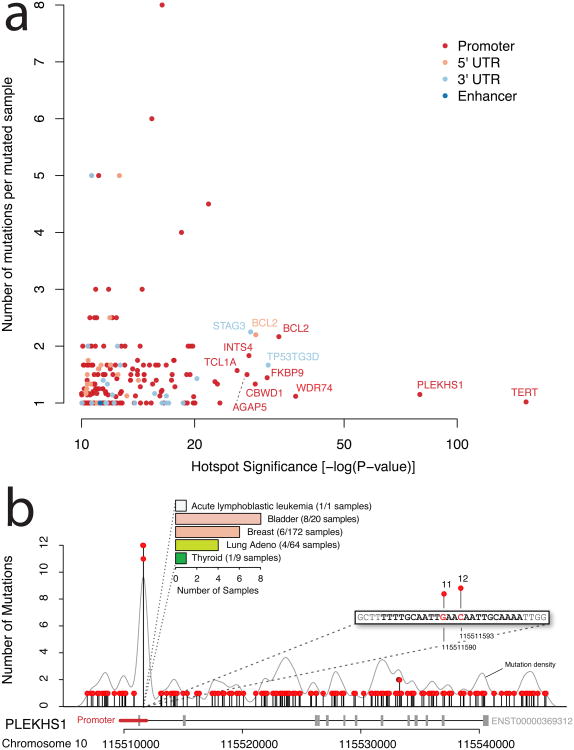
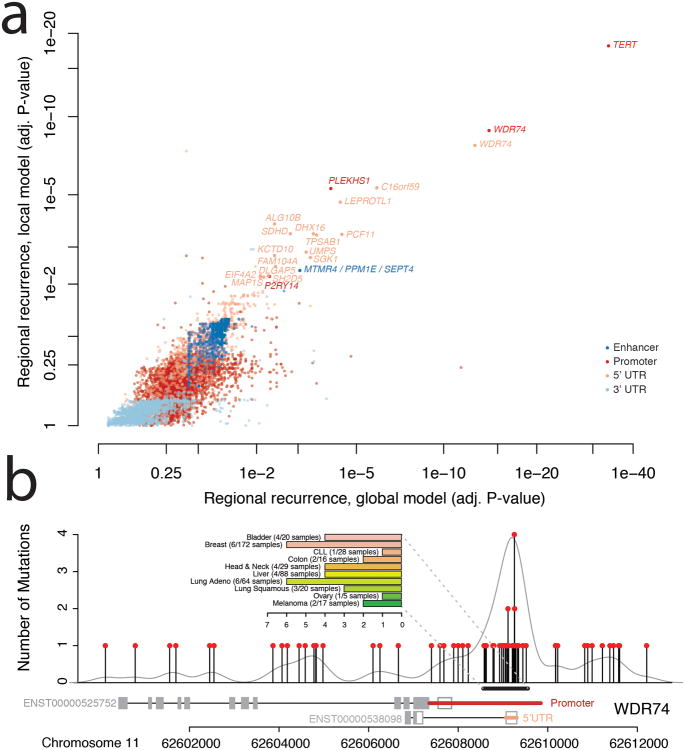
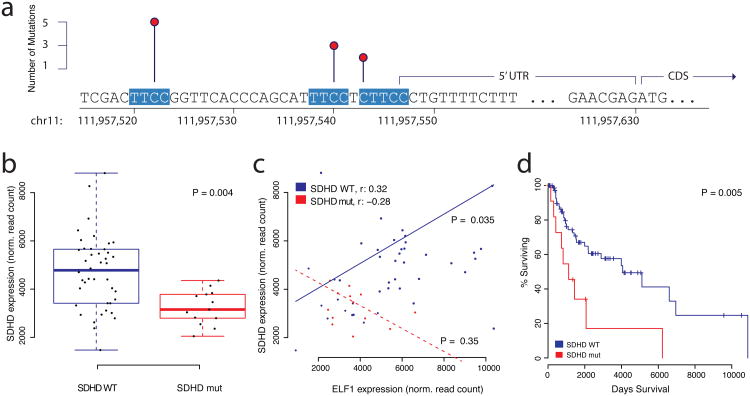
Cancer primarily develops because of somatic alterations in the genome. Advances in sequencing have enabled large-scale sequencing studies across many tumor types, emphasizing the discovery of alterations in protein-coding genes. However, the protein-coding exome comprises less than 2% of the human genome. Here we analyze the complete genome sequences of 863 human tumors from The Cancer Genome Atlas and other sources to systematically identify noncoding regions that are recurrently mutated in cancer. We use new frequency- and sequence-based approaches to comprehensively scan the genome for noncoding mutations with potential regulatory impact. These methods identify recurrent mutations in regulatory elements upstream of PLEKHS1, WDR74 and SDHD, as well as previously identified mutations in the TERT promoter. SDHD promoter mutations are frequent in melanoma and are associated with reduced gene expression and poor prognosis. The non-protein-coding cancer genome remains widely unexplored, and our findings represent a step toward targeting the entire genome for clinical purposes.


Conflict of interest statement

Competing Financial Interests: The authors declare no competing financial interests.

Figures

Figure 1
Figure 1
a) Tumor samples by disease type. Tumor types from TCGA are labeled in boldface; other published samples are shown in regular font. b) Mean mutation frequency and 95% confidence interval (n=858) across samples by type of genomic region. c) Workflow for identification of recurrent, non-coding mutations in regulatory regions of interest. Our approach integrates mutation calls from 863 tumor/normal pairs and regulatory regions of interest (ROIs), which are tested for non-coding mutations using three distinct analyses. Hotspot analysis detects recurrent mutations that are often very focal. Regional recurrence analysis identifies annotated regions of interest that are enriched for mutation throughout the entire region. Transcription factor analysis searches for regions that contain recurrent mutations within transcription factor binding sites.
Figure 2
Figure 2. Hotspot Analysis
a) Significance of mutation hotspots in non-coding regulatory regions. Hotspots are shown according to statistical significance (false discovery rate adjusted p-value on x-axis) and number of mutations per sample (y-axis). Colors represent the types of regulatory regions in which hotspots were found. b) Mutation hotspot in the promoter region of PLEKHS1, including two highly recurrent sites (11 and 12 mutations, respectively) located at the center of a palindromic sequence. Mutation density across the region is shown as grey curve. The bar chart summarizes the frequency of the hotspot mutation in individual cancer types (colors correspond to Figure 1a).
Figure 3
Figure 3. Regional Recurrence Analysis
a) Significance of recurrent mutations in regulatory regions of interest. Regulatory regions for individual genes are shown according to local (y-axis) and global (x-axis) measures of statistical significance (false discovery rate adjusted p-value). Colors represent types of regulatory region. b) Strong enrichment of mutations in the promoter region of WDR74 in contrast to the remainder of the gene sequence. The bar chart summarizes the frequency of the hotspot mutation in individual cancer types (colors correspond to Figure 1a).
Figure 4
Figure 4. Transcription Factor Analysis
Mutations in the promoter region of SDHD disrupt ETS transcription factor binding sites in melanoma cancer genomes. a) Three recurrently mutated sites in the promoter region of SDHD, each one altering a separate ETS recognition site, which are highly conserved and highlighted in red. b) SDHD mRNA expression is lower in melanoma samples with SDHD promoter mutations (n = 13, red) compared to ‘wild-type’ tumor samples (n = 42, blue). The box plot displays first and third quartiles (top and bottom of boxes), median (band inside boxes), and lowest/highest point within 1.5 × IQR of the lower/higher quartile (whiskers). c) mRNA expression between ELF1 (ETS transcription factor) and SDHD is positively correlated in samples without SDHD promoter mutations (n = 42, blue) and not in samples with SDHD promoter mutation (n = 13, red). d) Survival analysis shows that overall patient survival is significantly lower in samples with SDHD promoter mutations (n = 12, red) compared to the reference group (n = 88, blue).

Comment in

References

    1. Weinstein JN, et al. The Cancer Genome Atlas Pan-Cancer analysis project. Nature genetics. 2013;45:1113–20. - PMC - PubMed
    1. Hudson TJ, et al. International network of cancer genome projects. Nature. 2010;464:993–8. - PMC - PubMed
    1. Kandoth C, et al. Integrated genomic characterization of endometrial carcinoma. Nature. 2013;497:67–73. - PMC - PubMed
    1. Church DN, et al. DNA polymerase epsilon and delta exonuclease domain mutations in endometrial cancer. Human molecular genetics. 2013;22:2820–8. - PMC - PubMed
    1. Comprehensive molecular profiling of lung adenocarcinoma. Nature. 2014;511:543–550. - PMC - PubMed

Publication types

MeSH terms