. 2014 Oct;20(10):1157-64.
doi: 10.1038/nm.3672. Epub 2014 Sep 28.

Progranulin protects against amyloid β deposition and toxicity in Alzheimer's disease mouse models

Affiliations

Progranulin protects against amyloid β deposition and toxicity in Alzheimer's disease mouse models

S Sakura Minami et al. Nat Med. 2014 Oct.

Abstract

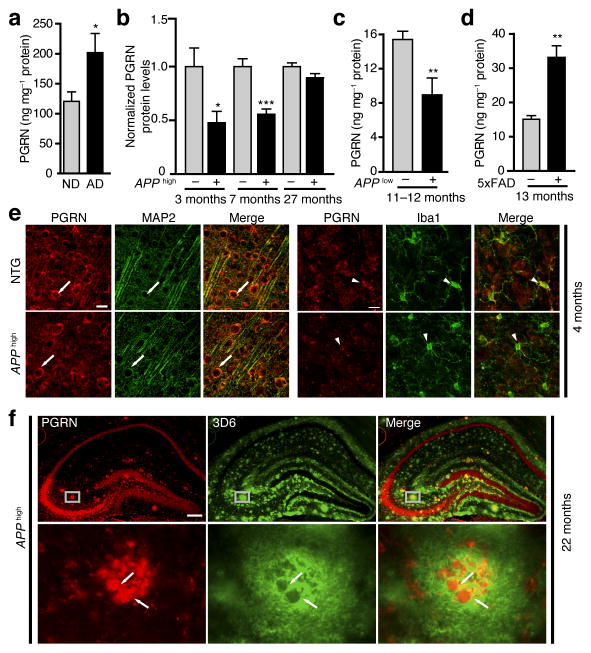
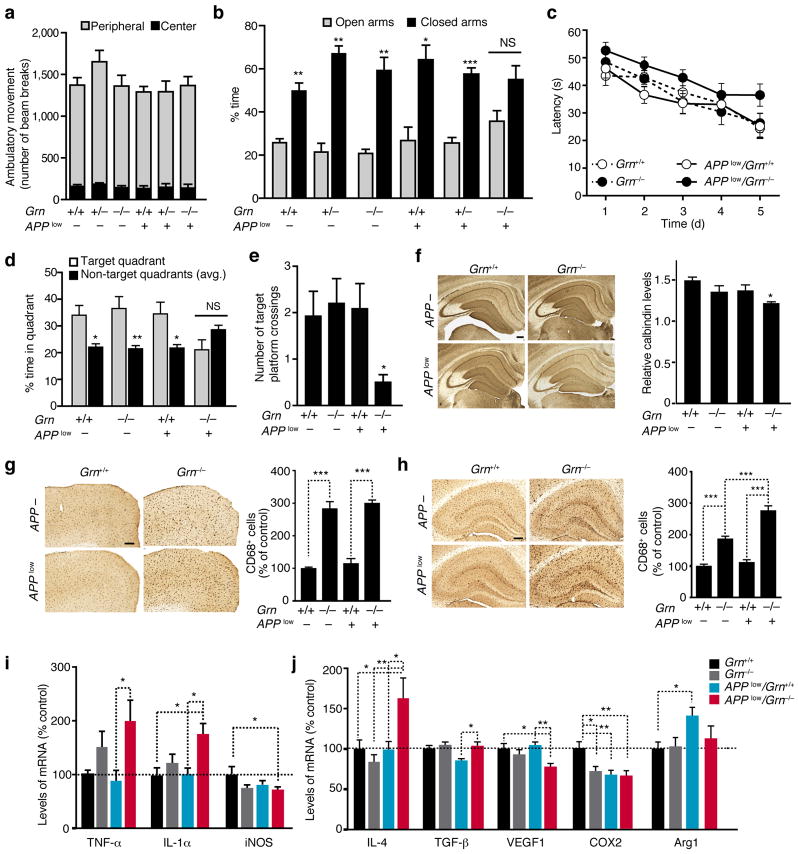
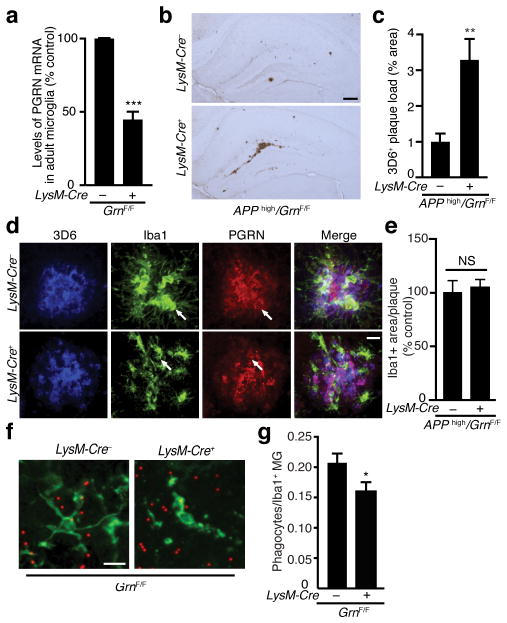
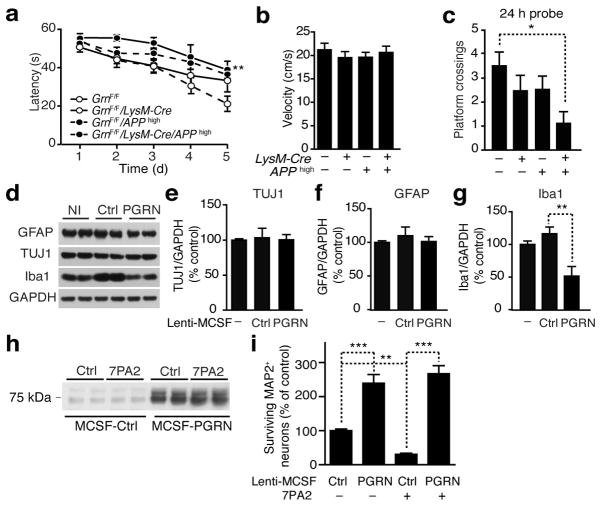
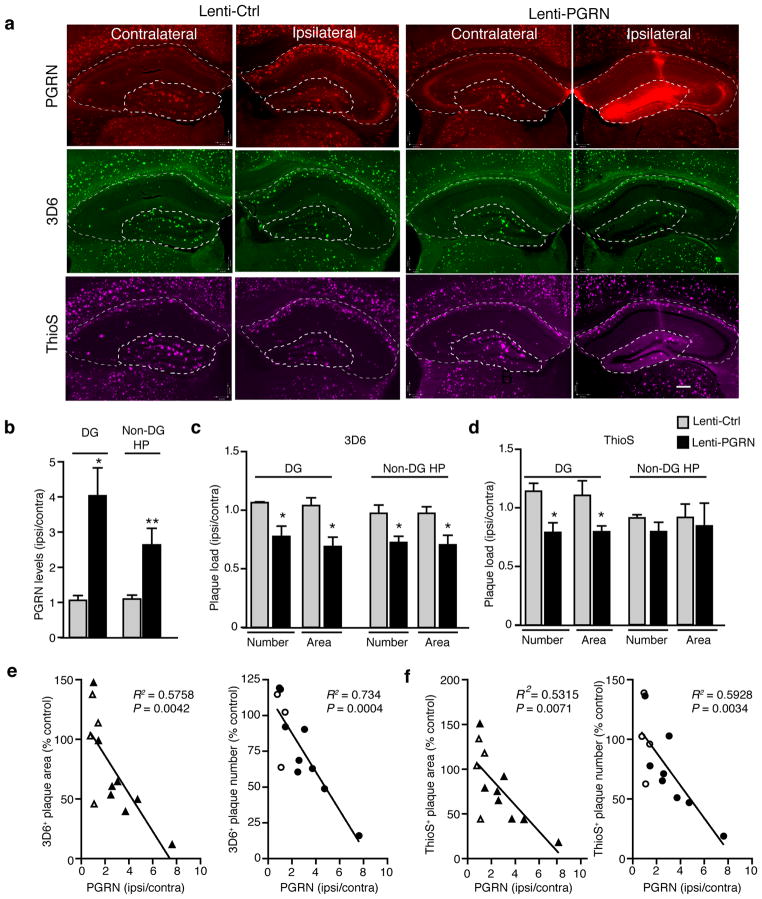
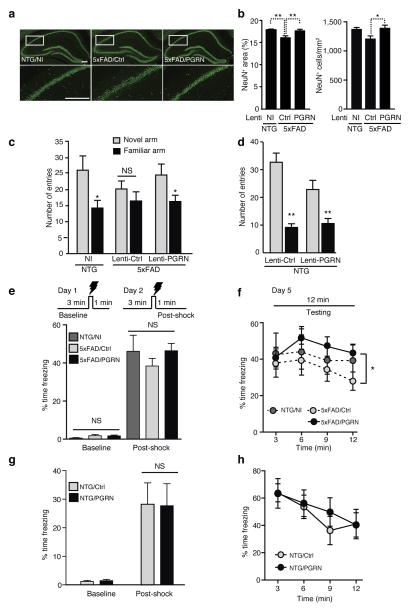
Haploinsufficiency of the progranulin (PGRN) gene (GRN) causes familial frontotemporal lobar degeneration (FTLD) and modulates an innate immune response in humans and in mouse models. GRN polymorphism may be linked to late-onset Alzheimer's disease (AD). However, the role of PGRN in AD pathogenesis is unknown. Here we show that PGRN inhibits amyloid β (Aβ) deposition. Selectively reducing microglial expression of PGRN in AD mouse models impaired phagocytosis, increased plaque load threefold and exacerbated cognitive deficits. Lentivirus-mediated PGRN overexpression lowered plaque load in AD mice with aggressive amyloid plaque pathology. Aβ plaque load correlated negatively with levels of hippocampal PGRN, showing the dose-dependent inhibitory effects of PGRN on plaque deposition. PGRN also protected against Aβ toxicity. Lentivirus-mediated PGRN overexpression prevented spatial memory deficits and hippocampal neuronal loss in AD mice. The protective effects of PGRN against Aβ deposition and toxicity have important therapeutic implications. We propose enhancing PGRN as a potential treatment for PGRN-deficient FTLD and AD.


Figures

Figure 1
Figure 1
Differential expression of PGRN in AD brains and in young and aged APP transgenic mice. (a) ELISA measurement of human PGRN protein levels in brains of AD patients and non-demented controls (n = 12, n = 11). *, P < 0.05, unpaired student’s t test. ND, non-demented. See Supplementary Table-1 for sample information. (b) ELISA measurement of mouse PGRN levels in APPhigh mice and littermate controls (n = 6, n = 7, n = 10, n = 8, n = 9, n = 10, from left to right). *, P < 0.05 by unpaired student’s t test; ***, P < 0.001 by Mann-Whitney non-parametric test. (c) ELISA measurement of PGRN levels in 11–12-month-old APPlow mice (n = 10, n = 9, respectively). **, P < 0.01 by Mann-Whitney non-parametric test. (d) ELISA measurement of PGRN levels in 13-month-old 5xFAD mice (n = 3, n = 6 respectively). **, P < 0.01 by unpaired student’s t test. (e) PGRN immunoreactivity is detected in both neurons (MAP2, arrow) and microglia (Iba1, arrow head) in non-transgenic (NTG) and APPhigh mice. Scale bar 25 μm. (f) PGRN immunoreactivity in amyloid plaques in aged APPhigh mice. Representative images of colocalization of PGRN (red) with amyloid plaques (anti-3D6, green) in the hippocampus of 22-month-old APPhigh mice. Bottom panels are higher magnification images of top panels. Scale bar 200 μm. Values are mean ± SEM (ad).
Figure 2
Figure 2
PGRN deficiency exacerbates Aβ-mediated behavioral and neuronal deficits and modulates the innate immunity in 9–13-month-old APPlow mice. (a) Locomotor activity in the open field (n = 10 mice/genotype). (b) Time spent in the open and closed arms of the elevated plus maze (n = 10 mice/genotype, *, P < 0.05, **, P < 0.01, ***, P < 0.001, paired student’s t-test). NS, not significant. (ce) Spatial learning and memory in MWM. (c) No significant differences were detected in spatial learning by longitudinal mixed effects model with linear time trend. (d,e) Probe trial performance after 24 h. (d) Time spent in target quadrant. *, P < 0.05, **, P < 0.01, paired student’s t-test. There was a trend towards interaction of the APP and Grn genotype variables for target quadrant % time, P = 0.06 (n = 13, n = 12, n = 12, n = 11). (e) Total number of target platform crossings. *P < 0.05, two-way ANOVA, Bonferroni posthoc analyses (n = 12, n = 12, n = 11, and n = 10). (f) (left) Calbindin immunostaining in the hippocampus. Scale bar, 200 μm. (right) Quantification of calbindin levels (n = 13, n = 12, n = 12, n = 11). *, P < 0.05, two-way ANOVA, Tukey-Kramer posthoc analyses. Variances were significantly different between groups. (g, h) CD68 immunoreactivity in cortex (g) and hippocampus (h). (left) CD68+ immunostaining of cortical (g) or hippocampal (h) sections. Scale bar, 200 μm. (right) Quantification of CD68+ immunoreactivity (n = 13, n = 12, n = 12, n = 11), ***, P < 0.001, two-way ANOVA, Tukey-Kramer posthoc analyses. Variances were significantly different between groups. There was a significant interaction between the APP and Grn genotype variables in hippocampal CD68+ immunoreactivity,*** P < 0.001. (i, j) qRT-PCR measurements of levels of M1 (i) or M2 (j) inflammatory markers from the cortex (n = 7, n = 7, n = 5, n = 5), *, P < 0.05, **, P < 0.01 by two-way ANOVA, Tukey-Kramer posthoc analyses. Variances were significantly different between groups for TNF-α and iNOS. There was a significant interaction between the APP and Grn genotype variables in IL-4, VEGF1, and COX2, * P < 0.05.
Figure 3
Figure 3
Microglial PGRN deficiency increases plaque deposition and impairs phagocytosis. (a) Quantification of PGRN mRNA in microglia isolated from adult GrnF/F mice with real-time RT-PCR. n = 4 (pooled from 10 mice), n = 3 (pooled from 8 mice), ***, P < 0.001, unpaired student t-test. Variances were significantly different between groups. (bc) Effects of microglial PGRN deficiency on plaque load in APPhigh mice. (b) Representative photomicrograph of amyloid plaques detected with 3D6 antibody. Scale bar, 200 μm. (c) Quantification of 3D6-positive plaque load in APPhigh mice with normal or deficient microglial PGRN, n = 8, n = 9, **, P < 0.01, unpaired student t-test. Variances were significantly different between groups. (d) Colocalization of PGRN (red) with microglia (anti-IbaI, green) and amyloid deposition (3D6, blue). Scale bar, 10 μm. (e) Quantification of the number of Iba1+ microglia per 3D6+ plaque in APPhigh mice with normal or deficient microglial PGRN (n = 9, n = 10). (fg) Phagocytosis of fluorescent beads by LysM-Cre+/GRNF/F microglia. (f) Representative photomicrograph of acute slice sections from 8-month-old mice incubated with fluorescent beads. (g) Quantification of the number of Iba1-positive phagocytes normalized to total number of Iba1-positive cells, n = 34 fields of view from 3 mice, n = 35 fields of view from 4 mice, *, P < 0.05, mixed effects model. Scale bar, 10 μm.
Figure 4
Figure 4
Microglial PGRN protects against Aβ toxicity. (ac) Spatial learning and memory in MWM in APPhigh mice. (a) Learning curve to locate the hidden platform. **, P < 0.01, by longitudinal mixed effects model with linear time trend. (b) Average swim speed across all training days. (c) Number of target platform crossings after 24 h (n = 11, n = 10, n = 9, n = 7, *, P < 0.05 by two-way ANOVA, Tukey-Kramer posthoc analyses). (dg) Effects of viral PGRN overexpression in mixed cortical cultures. (d) Representative western blots of cell lysates from primary cultures infected with Lenti-MCSF-Ctrl or Lenti-MCSF-PGRN. Non-infected (NI). (eg) Quantification of TUJ1 (e), GFAP (f), and Iba1 (g). n = 6 from three independent experiments performed in duplicates, **, P < 0.01 by one-way ANOVA, Tukey-Kramer posthoc analyses. (h–i) Effects of microglial PGRN on Aβ toxicity in vitro. (h) Representative western blot of supernatants from mixed cortical cultures infected with Lenti-MCSF-Ctrl or Lenti-MCSF-PGRN treated with Aβ oligomers (7PA2). (i) Aβ toxicity measured by survival of MAP2+ neurons. n = 84, n = 83, n = 82, n = 82 fields of view from two independent experiments, **, P < 0.01, ***, P < 0.001, by mixed effects model and multiple comparison correction using the method of Holm.
Figure 5
Figure 5
PGRN overexpression in hippocampus decreases amyloid plaque load in 5xFAD mice. (a) Representative images of the contralateral and ipsilateral hemispheres of Lenti-Ctrl- and Lenti-PGRN-injected 5xFAD mice. Dashed lines indicate boundaries used for quantification of dentate gyrus (DG) and non-dentate gyrus hippocampal (non-DG HP) areas. PGRN (red), 3D6+ plaques (green), and ThioS+ plaques (magenta). Scale bar, 200 μm. (b) Quantification of PGRN immunostaining normalized to the uninjected contralateral hemisphere for Lenti-Ctrl- or Lenti-PGRN-injected mice. Two Lenti-PGRN-injected mice lacking sufficient overexpression (i.e. < 2 fold) were excluded. n = 4 (Lenti-Ctrl), n = 6 (Lenti-PGRN), *, P < 0.05, **, P < 0.01, unpaired student’s t-test. (cd) Quantification of 3D6+ (c) and ThioS+ (d) plaque load by number and area. Two Lenti-PGRN injected mice lacking sufficient overexpression (i.e. < 2 fold) were excluded. n = 4 (Lenti-Ctrl), n = 6 (Lenti-PGRN)*, P < 0.05, **, P < 0.01, unpaired student’s t-test. Welch’s correction was applied for DG 3D6+ plaque number to account for significantly different variance between groups. (ef) Pearson correlation analyses of PGRN levels (normalized to the contralateral side) with the number or area of 3D6+ (e) or ThioS+ (f) amyloid plaques in the dentate gyrus. Open triangle or circle (Lenti-Ctrl), closed triangle or circle (Lenti-PGRN). n = 12.
Figure 6
Figure 6
Lentiviral PGRN overexpression prevents neuronal loss and hippocampus-dependent memory deficits in 5xFAD mice. (a,b) Effects of PGRN overexpression on neuronal loss. (a) Representative images of NeuN staining in hippocampus. Scale bar, 200 μm. Bottom panels are higher magnification images of top panels. (b) Quantification of number and area of NeuN+ cells in the hippocampus. n = 12, n = 14, n = 14 from 6 (NI), 7 (Lenti-Ctrl), or 7 (Lenti-PGRN) mice, *, P < 0.05, **, P < 0.01, mixed effects model and multiple comparison correction using the method of Holm. (c,d) Cued Y-maze spatial memory performance in PGRN-overexpressing 5xFAD (c) or non-transgenic (d) mice. n = 9, n = 12, n = 13, *, P < 0.05; NS, not significant, paired student’s t-test (c). Lenti-Ctrl-injected 5xFAD mice were analyzed by Wilcoxon signed rank test of pairs. n = 6, n = 7, **, P < 0.01, paired student’s t-test (d). (eh) Contextual fear conditioning in 5xFAD (e,f) or non-transgenic (g,h) mice. (e,g) Quantification of freezing time on Day 1 for 3 min pre-shock (baseline) and on Day 2 for 1 min post-shock. n = 7, n = 12, n = 13 (e); n = 6, n = 7 (g). (f,h) Quantification of freezing time in 3-min intervals on Day 5 testing. n = 7, n = 12, n = 13, *, P < 0.05, by analysis of min 6–12 by mixed effects model and Tukey-Kramer post-hoc analysis (f). Two mice from the NTG/NI group were statistical outliers (> 2 S.D.) due to low freezing during testing, thus excluded from analysis. n = 6, n = 7, not significant (NS) by analysis of min 6–12 by mixed effects model and Tukey-Kramer post-hoc analysis (h).

Comment in

References

    1. Daniel R, He Z, Carmichael KP, Halper J, Bateman A. Cellular localization of gene expression for progranulin. J Histochem Cytochem. 2000;48:999–1009. - PubMed
    1. Daniel R, Daniels E, He Z, Bateman A. Progranulin (acrogranin/PC cell-derived growth factor/granulin-epithelin precursor) is expressed in the placenta, epidermis, microvasculature, and brain during murine development. Dev Dyn. 2003;227:593–599. - PubMed
    1. Petkau TL, et al. Progranulin expression in the developing and adult murine brain. J Comp Neurol. 2010;518:3931–3947. - PubMed
    1. Baker M, et al. Mutations in progranulin cause tau-negative frontotemporal dementia linked to chromosome 17. Nature. 2006;442:916–919. - PubMed
    1. Cruts M, et al. Null mutations in progranulin cause ubiquitin-positive frontotemporal dementia linked to chromosome 17q21. Nature. 2006;442:920–924. - PubMed

Publication types

MeSH terms