

Shiny-phyloseq: Web application for interactive microbiome analysis with provenance tracking
- PMID: 25262154
- PMCID: PMC4287943
- DOI: 10.1093/bioinformatics/btu616
Shiny-phyloseq: Web application for interactive microbiome analysis with provenance tracking
Abstract
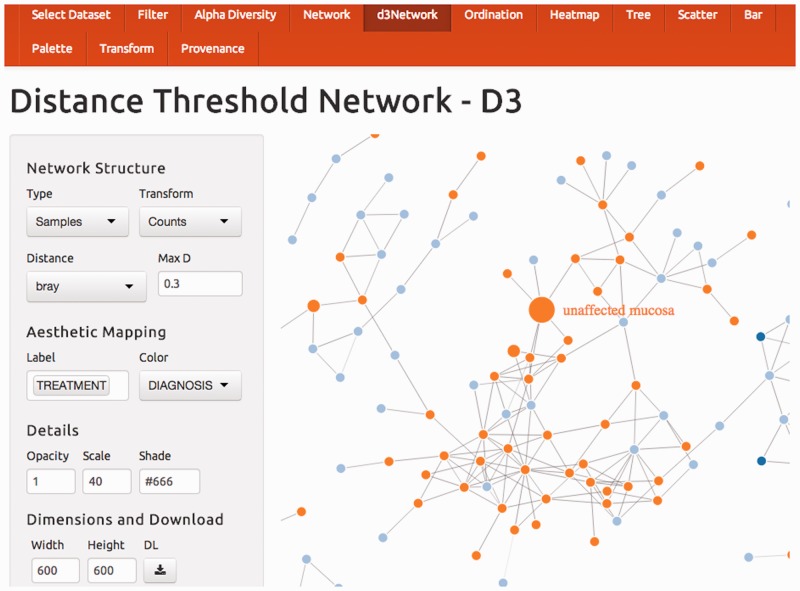
We have created a Shiny-based Web application, called Shiny-phyloseq, for dynamic interaction with microbiome data that runs on any modern Web browser and requires no programming, increasing the accessibility and decreasing the entrance requirement to using phyloseq and related R tools. Along with a data- and context-aware dynamic interface for exploring the effects of parameter and method choices, Shiny-phyloseq also records the complete user input and subsequent graphical results of a user's session, allowing the user to archive, share and reproduce the sequence of steps that created their result-without writing any new code themselves.
Availability and implementation: Shiny-phyloseq is implemented entirely in the R language. It can be hosted/launched by any system with R installed, including Windows, Mac OS and most Linux distributions. Information technology administrators can also host Shiny--phyloseq from a remote server, in which case users need only have a Web browser installed. Shiny-phyloseq is provided free of charge under a GPL-3 open-source license through GitHub at http://joey711.github.io/shiny-phyloseq/.
© The Author 2014. Published by Oxford University Press.
Figures
References
-
- Allaire J, et al. The Markdown Package: Markdown Rendering for R. CRAN. 2014.
-
- Bostock M, et al. D3: data-driven documents. IEEE Trans. Vis. Comput. Graph. 2011;17:2301–2309. - PubMed
Publication types
MeSH terms
Grants and funding
LinkOut - more resources
Full Text Sources
Other Literature Sources
