. 2014 Nov;11(11):1170-6.
doi: 10.1038/nmeth.3142. Epub 2014 Sep 24.

Small molecules facilitate rapid and synchronous iPSC generation

Affiliations

Small molecules facilitate rapid and synchronous iPSC generation

Ori Bar-Nur et al. Nat Methods. 2014 Nov.

Abstract

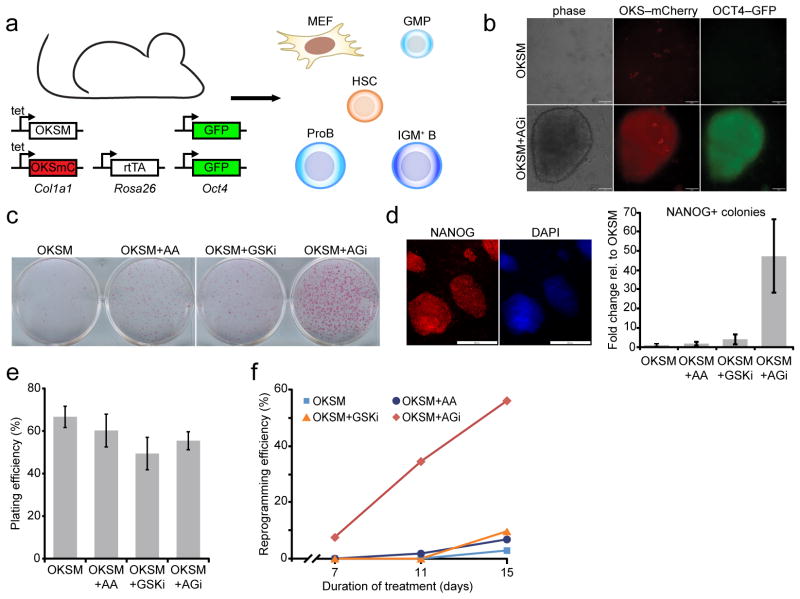
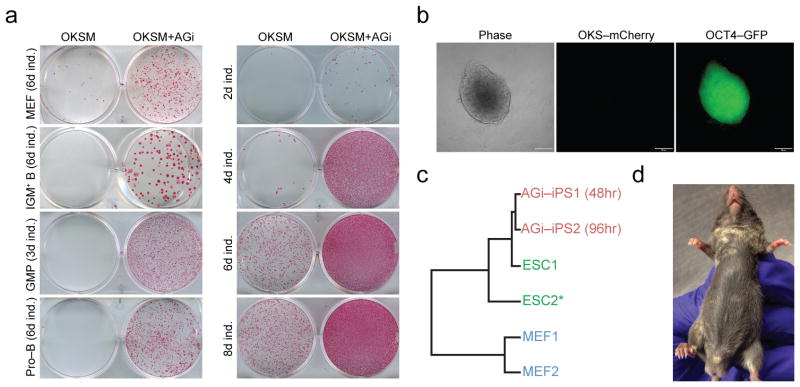
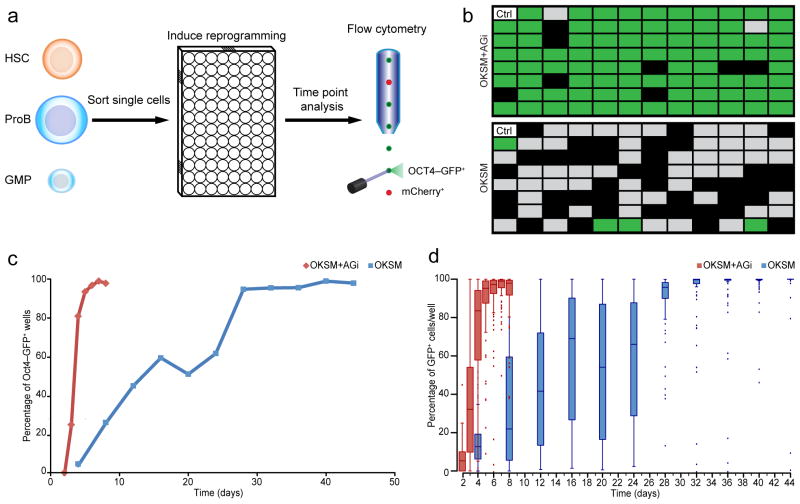
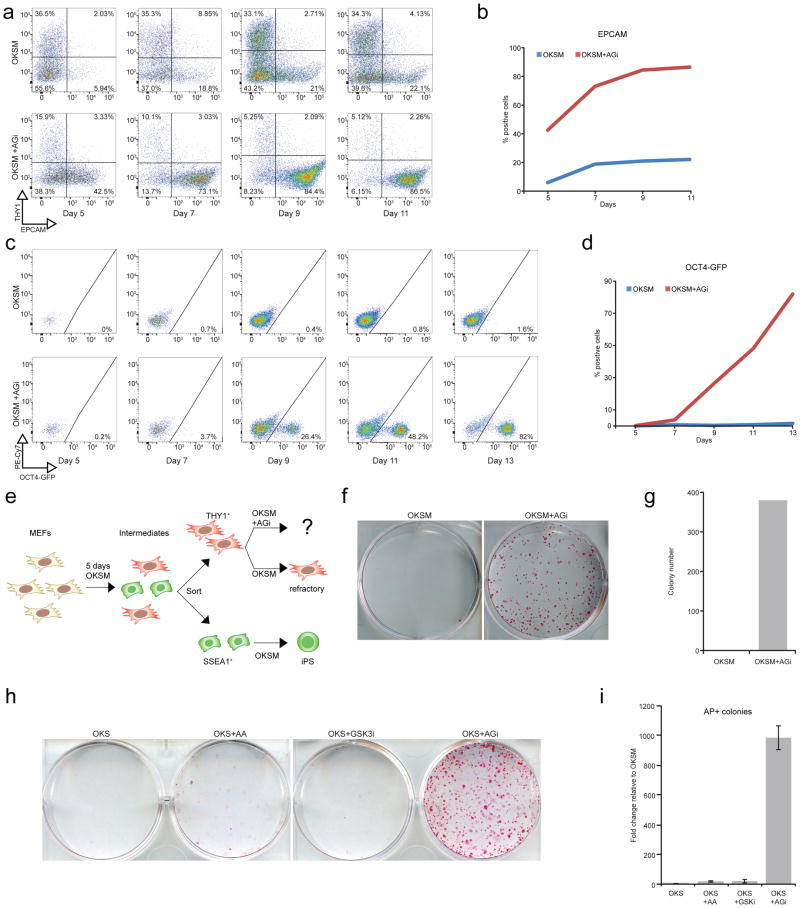
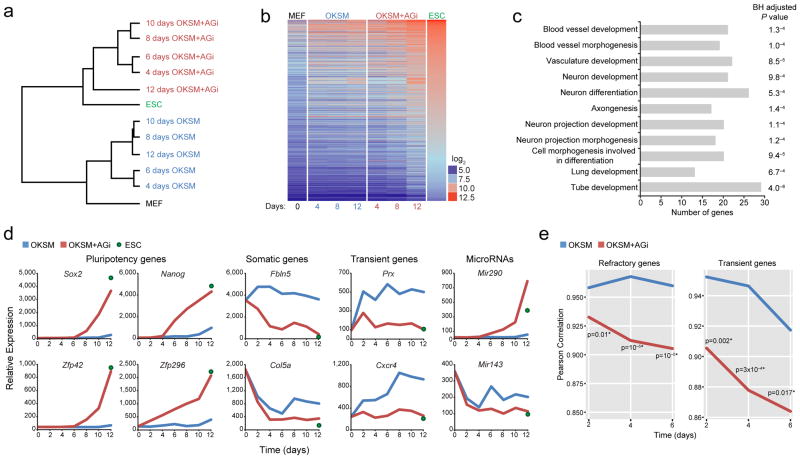
The reprogramming of somatic cells into induced pluripotent stem cells (iPSCs) upon overexpression of OCT4, KLF4, SOX2 and c-MYC (OKSM) provides a powerful system to interrogate basic mechanisms of cell fate change. However, iPSC formation with standard methods is typically protracted and inefficient, resulting in heterogeneous cell populations. We show that exposure of OKSM-expressing cells to both ascorbic acid and a GSK3-β inhibitor (AGi) facilitates more synchronous and rapid iPSC formation from several mouse cell types. AGi treatment restored the ability of refractory cell populations to yield iPSC colonies, and it attenuated the activation of developmental regulators commonly observed during the reprogramming process. Moreover, AGi supplementation gave rise to chimera-competent iPSCs after as little as 48 h of OKSM expression. Our results offer a simple modification to the reprogramming protocol, facilitating iPSC induction at unparalleled efficiencies and enabling dissection of the underlying mechanisms in more homogeneous cell populations.


Conflict of interest statement

COMPETING FINANCIAL INTERESTS

None of the authors have competing financial interests

Figures

Figure 1
Figure 1
Ascorbic acid and GSK3-beta inhibitor (“AGi”) act synergistically on reprogramming. (a) Schematic of inducible, secondary reprogramming system. (b) Top panel: OKSM-expressing GMPs (as indicated by mCherry fluorescence) that remain OCT4-GFP negative after 8 days of doxycycline treatment. Bottom panel: a nascent iPSC colony after 8 days of treatment with doxycycline+AGi, showing OCT4-GFP and mCherry fluorescence (scale bar is 50 μm). (c) Alkaline phosphatase staining of doxycyline-independent, MEF-derived iPSC colonies, documenting individual and synergistic effects of ascorbic acid (AA) and GSK3-beta inhibitor (GSKi) on iPSC formation. Cells were subjected to reprogramming for 9 days, at which point doxycycline and supplements were withdrawn for an additional 3 days. (d) Representative staining of NANOG-positive iPSC colonies generated with AGi (scale bar is 200 μm). A quantitative representation of reprogramming efficiency based on transgene-independent NANOG-positive clones for the indicated conditions (n=3 biological replicates, error bars represent standard deviation for three independent experiments). (e) Plating efficiency for clonal reprogramming analyses using MEFs. Values represent the mean for three independent time points and error bars represent standard deviation. (f) Clonal analysis of reprogramming efficiency for single MEFs expressing OKSM under the indicated conditions. OKSM, Oct4, Klf4, Sox2, c-Myc; mC, mCherry; MEF, murine embryonic fibroblast; GMP, granulocyte/macrophage progenitor; HSC, hematopoietic stem cell.
Figure 2
Figure 2
AGi enhances and accelerates iPSC formation across different cell types. (a) Left panel: effect of AGi on reprogramming potential of different cell types. Doxycycline was withdrawn at the indicated time points (ind., induction) and colonies were assessed for alkaline phosphatase (AP) staining 3 days after doxycycline withdrawal. Right panel: Time course analysis for reprogramming potential of GMPs. Transgene-independent iPSC colonies were obtained from GMPs after 2 days of doxycycline induction in the presence of AGi, followed by 6 days of doxycycline-independent growth. (b) Day 2 iPSCs express OCT4-GFP but no longer express OKSM (mCherry negative; scale bar is 100 um) following doxycycline withdrawal. (c) Cluster analysis based upon global gene expression analysis of the indicated samples. Note that expression data from the ESC2 line was previously published. (d) Chimeric mouse showing donor-derived agouti coat color contribution from iPSCs generated in (b).
Figure 3
Figure 3
Clonal analysis of GMP reprogramming indicates synchronous reprogramming with AGi. (a) Schematic for clonal reprogramming assay in 96-well plates. (b) Representative example from three technical replicates of clonal reprogramming analysis of GMPs at day 6 of OKSM expression in control (doxycycline alone) vs. AGi (doxycycline plus AGi) setting. Green fields represent wells of a 96 well-plate that contained 53% or more OCT4-GFP+ cells and were thus regarded iPSCs (see also text and methods section); gray fields were GFP-negative or contained less than 53% OCT4-GFP+ cells; black fields represent wells in which fewer than 10 cells were detected. (c) Time course analysis of clonal iPSC formation in the presence or absence of AGi. (d) Examination of intra-well heterogeneity of OCT4-GFP expression in GMPs during the course of reprogramming. Box and whisker plots were used in which the band in the middle of the box represents the median; the top and bottom part of the box represent the first and third quartiles. The whiskers represent the lowest and highest value within 1.5-fold of the inter-quartile ranges.
Figure 4
Figure 4
AGi rescues the reprogramming defect of refractory cells. (a) FACS analysis of reprogramming intermediates in bulk MEF populations at days 5, 7, 9, 11 of OKSM or OKSM+AGi expression. Note the more homogeneous shift of intermediates from THY1+ to THY1-/EPCAM+ cells. (b) Graph summarizing the percentages of EPCAM+ cells depicted in (a). (c) FACS analysis for OCT4-GFP expression in bulk MEF populations at days 5, 7, 9, 11, and 13 of OKSM or OKSM+AGi expression. PE-Cy7 was used as an autofluorescent control with emission filter 750 nm. (d) Graph summarizing the percentages of OCT4-GFP+ cells shown in (c). (e) Schematic outlining the attempt to restore reprogramming potential in THY1+ refractory cells sorted at day 5 of OKSM expression. (f) AP staining for refractory, THY1+ intermediates following continued OKSM expression (doxycycline exposure) under the indicated conditions. Doxycylcine was removed for an additional 4 days prior to analysis to ensure transgene independence. (g) Quantification for the results shown in (f). Replicate analyses and individual treatment with ascorbic acid and GSK3-beta inhibitor are shown in Supplementary Figure 6. (h) AP staining for cells expressing OKS under the indicated conditions. Doxycylcine was removed for an additional 4 days prior to analysis to ensure transgene independence. (i) Quantification for the results shown in (h)(n=3 technical replicates).
Figure 5
Figure 5
Effect of AGi on gene expression patterns in reprogramming intermediates. (a) Unsupervised clustering of global gene expression analysis of indicated samples. “4–12 days OKSM” represent reprogrammable MEFs exposed for 4–12 days to doxycycline in the absence or presence of AGi. (b) A heat map showing expression levels for genes that were greater than three-fold higher in ESCs relative to MEFs. (c) DAVID functional analysis of genes whose expression is downregulated at least 1.5 fold in response to AGi treatment in MEFs expressing OKSM/OKSM+AGi. Note the prevalence of developmental regulators. A Benjamini-Hochberg (BH) adjusted p-value is presented. (d) Examples of somatic, pluripotency, microRNA, and transient developmental genes that change expression in response to doxycycline/AGi treatment. (e) Expression patterns of gene sets associated with a refractory phenotype (left panel) or transient upregulation during reprogramming (right panel) were compared with expression patterns obtained after OKSM expression in the presence or absence of AGi. Statistical significance is indicated with asterisks (One-tailed Fischer test).

References

    1. Takahashi K, Yamanaka S. Induction of pluripotent stem cells from mouse embryonic and adult fibroblast cultures by defined factors. Cell. 2006;126:663–676. - PubMed
    1. Yu J, et al. Induced pluripotent stem cell lines derived from human somatic cells. Science. 2007;318:1917–1920. - PubMed
    1. Takahashi K, et al. Induction of pluripotent stem cells from adult human fibroblasts by defined factors. Cell. 2007;131:861–872. - PubMed
    1. Stadtfeld M, Hochedlinger K. Induced pluripotency: history, mechanisms, and applications. Genes Dev. 2010;24:2239–2263. - PMC - PubMed
    1. Eminli S, et al. Differentiation stage determines potential of hematopoietic cells for reprogramming into induced pluripotent stem cells. Nat Genet. 2009;41:968–976. - PMC - PubMed

Publication types

MeSH terms