. 2014 Oct;32(10):1011-8.
doi: 10.1038/nbt.3018. Epub 2014 Sep 28.

Enzyme clustering accelerates processing of intermediates through metabolic channeling

Affiliations

Enzyme clustering accelerates processing of intermediates through metabolic channeling

Michele Castellana et al. Nat Biotechnol. 2014 Oct.

Abstract

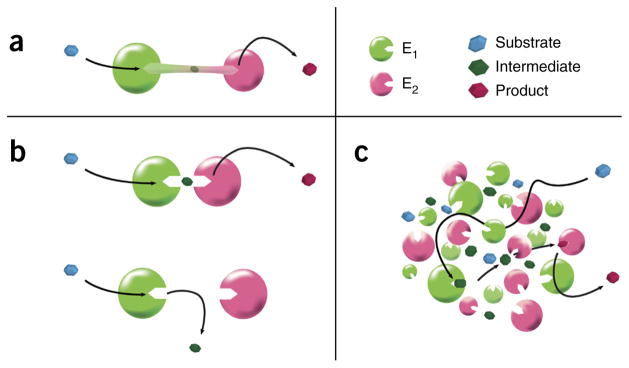
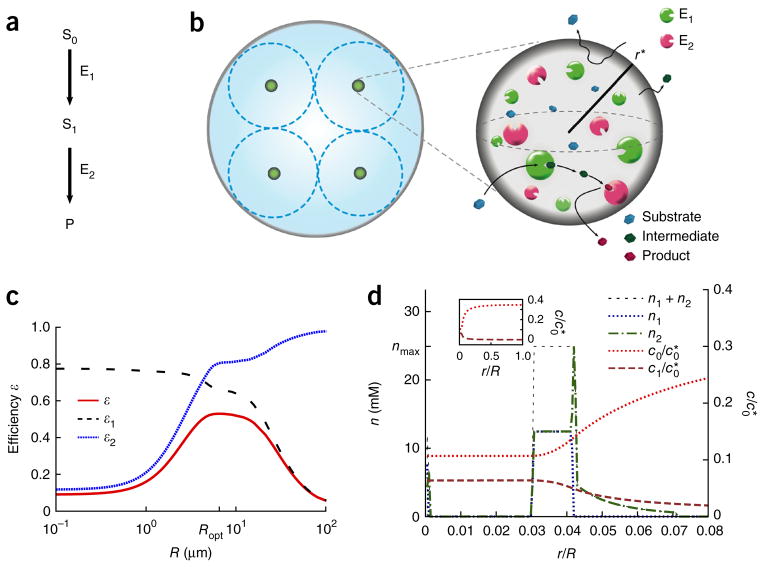
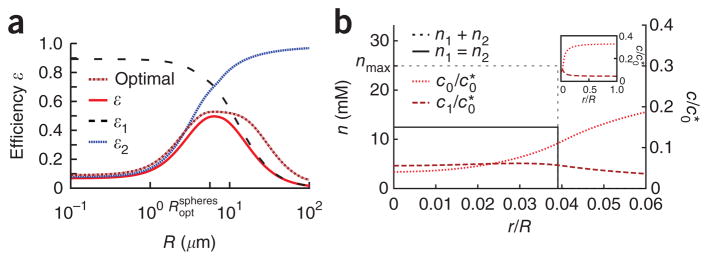
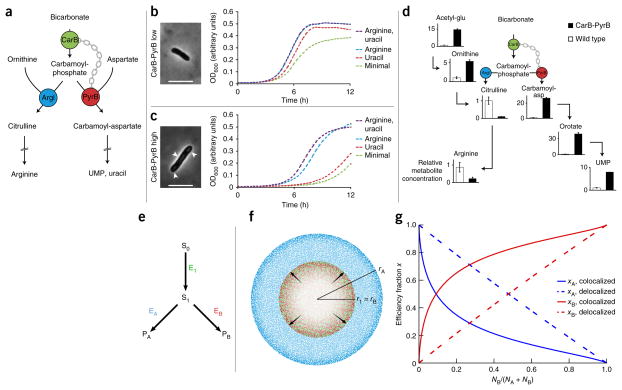
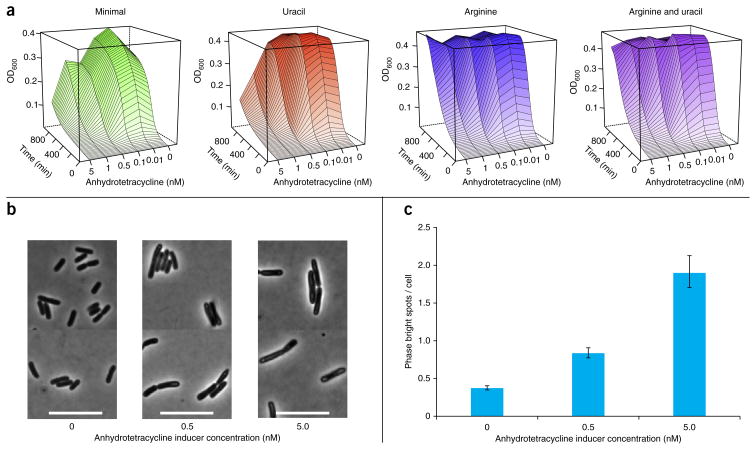
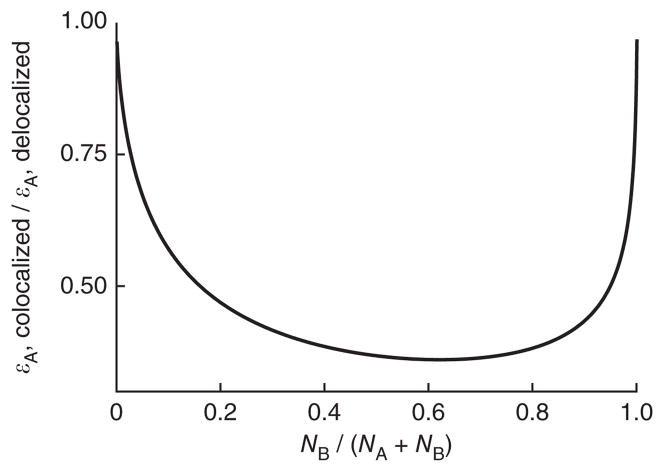
We present a quantitative model to demonstrate that coclustering multiple enzymes into compact agglomerates accelerates the processing of intermediates, yielding the same efficiency benefits as direct channeling, a well-known mechanism in which enzymes are funneled between enzyme active sites through a physical tunnel. The model predicts the separation and size of coclusters that maximize metabolic efficiency, and this prediction is in agreement with previously reported spacings between coclusters in mammalian cells. For direct validation, we study a metabolic branch point in Escherichia coli and experimentally confirm the model prediction that enzyme agglomerates can accelerate the processing of a shared intermediate by one branch, and thus regulate steady-state flux division. Our studies establish a quantitative framework to understand coclustering-mediated metabolic channeling and its application to both efficiency improvement and metabolic regulation.


Conflict of interest statement

COMPETING FINANCIAL INTERESTS

The authors declare no competing financial interests.

Figures

Figure 1
Figure 1
Different types of intermediate channeling in a two-step metabolic pathway, where a substrate is processed by enzyme E1 and turned into intermediate, which is then processed by enzyme E2 and turned into product. (a) Direct channeling. The intermediate is funneled from enzyme E1 to enzyme E2 by means of a protein tunnel that connects the active sites of E1 and E2, thus preventing the intermediate from diffusing away. (b) Proximity channeling. Top: E1 and E2 are positioned near enough to each other such that the intermediate produced by E1 is processed by E2 before it can escape by diffusion, even in the absence of an actual channel. Bottom: if E1 and E2 are not near enough to each other, an intermediate molecule produced by E1 escapes by diffusion, and it cannot be processed by E2. (c) Enzyme clustering. Once E1 produces an intermediate molecule, even though the probability of the intermediate being processed by any individual E2 enzyme is low, the probability that the intermediate will be processed by one of the many E2 enzymes in the agglomerate can be high.
Figure 2
Figure 2
Two-step metabolic pathway with an unstable intermediate. (a) The two-step metabolic pathway. Substrate S0 is processed by enzyme E1 and turned into intermediate S1, which is then processed by enzyme E2 and turned into product P. (b) Enzyme configurations in the two-step metabolic pathway. Left: the cell cytoplasm is divided into multiple identical basins, each basin is represented by a dashed circle. Within each basin, enzymes are clustered into a central spherical agglomerate (shown in green). Right: blow-up showing the dynamics of the metabolic pathway within an agglomerate with radius r*. Substrate S0, which is produced throughout the cytoplasm, is processed by E1 and turned into S1, which is then processed by E2. Both S0 and S1 may escape from the agglomerate by diffusion. (c) Metabolic pathway efficiency ε and efficiencies of the first and second step ε1, ε2 as functions of basin radius R. For each R, efficiency is optimized over enzyme densities n1(r),n2(r), which are assumed to be spherically symmetric. Local enzyme density is constrained by n1(r) + n2(r)≤nmax, and the total catalytic activity is fixed to κcat. The efficiencies of the first and second step ε1, ε2 are a decreasing and an increasing function of R respectively. Hence, the optimal efficiency is obtained as a tradeoff between ε1 and ε2, and is equal to εopt = 0.53 at Ropt = 6.5 μm. Except where noted, k1 = k2 and parameter values are the same for all figures. The optimal efficiency εopt = 0.53 is about 5.9 times larger than the efficiency εdelocalized = 0.09 of a delocalized configuration where enzymes are uniformly distributed in space. (d) Optimal distributions of enzymes E1,E2 and corresponding concentrations of substrate S0 and intermediate S1 as functions of r/R, where the optimal basin radius (i.e., half the optimal spacing between clusters) is R = Ropt = 6.5 μm from b. The local enzyme density n1(r) + n2(r) and its maximal value nmax are also shown. The optimal enzyme distribution is a compact cluster with radius r* ≈ 0.26 μm composed of a shell of E1 and E2 surrounded by a halo of E2. Inset: concentrations of substrate S0 and intermediate S1 as functions of r/R in the entire basin.
Figure 3
Figure 3
Two-step metabolic pathway with an unstable intermediate for uniform enzyme spheres with equal density. (a) Metabolic pathway efficiency for uniform enzyme spheres of enzymes E1 and E2 with N1 = N2 compared to the optimal case from Figure 2c, and efficiencies of the first and second step of the pathway for uniform enzyme spheres as functions of basin radius R. For each R, efficiency is optimized over enzyme densities n1(r),n2(r), which are assumed to be spherically symmetric. Local enzyme density is constrained by n1(r) + n2(r)≤nmax, and the total catalytic activity is fixed to κcat. The optimal efficiency and radius for uniform enzyme spheres are εoptspheres=0.50 and Roptspheres=6.15μm, close to the values εopt = 0.53 and Ropt = 6.5 μm obtained for the fully optimized case. (b) Optimal distributions of enzymes E1,E2 and corresponding concentrations of substrate S0 and intermediate S1 for uniform enzyme spheres of enzymes E1 and E2 as functions of r/R, where the basin radius is R=Roptspheres=6.15μm from a. The local enzyme density n1(r) + n2(r) and its maximal value nmax are also shown. The optimal enzyme distribution is a compact cluster with radius r* ≈ 0.25 μm composed of a sphere uniformly filled with enzymes E1 and E2. Inset: concentrations of substrate S0 and intermediate S1 as functions of r/R in the entire basin region.
Figure 4
Figure 4
Metabolic pathway with a branch point, in E. coli. (a) The arginine/pyrimidine branch point in E. coli. CarB (with CarA, not shown) synthesizes carbamoyl phosphate, which can be committed towards arginine biosynthesis by ArgI or towards pyrimidine (e.g., uracil, UMP) synthesis by PyrB. For our experiments we fused CarB to PyrB (CarB-PyrB). Ornithine and aspartate are, respectively, arginine-specific and pyrimidine-specific biosynthetic reactants upstream of the branch point. (b) (left) Expression of CarB-PyrB at the low level characteristic of the endogenous carB gene does not produce phase-bright foci and (right) does not generate arginine pseudoauxotrophy. Cell density is plotted versus time in minimal conditions, in the presence of additional arginine, additional uracil, and both additional arginine and additional uracil (scale bar, 5 μm). Optical densities plotted are the mean ± s.e.m. (Nreplicates = 6). (c) (left) High-level expression of CarB-PyrB induces the formation of phase-bright foci, indicated by arrows, and (right) causes arginine pseudoauxotrophy. The same quantities as in b are plotted (scale bar, 5 μm, Nreplicates = 12). (d) The arginine pseudoauxotrophy results from metabolite shunting. Metabolomic analysis reveals that high-level CarB-PyrB expression causes the pyrimidine pathway pools to increase whereas the arginine pathway pools decrease downstream of ArgI but increase upstream of ArgI. Relative metabolite levels are the mean ± s.e.m. (e) Two-step metabolic pathway with a branch point. Substrate S0 is processed by enzyme E1 and turned into substrate S1. Substrate S1 is then processed by either enzyme EA or EB and turned into product PA or PB, respectively. (f) Schematics of the spatial distributions of enzymes E1,EA,EB in the colocalized case. E1 and EB are uniformly distributed in a compact sphere of radius r1 = rBr* ≤ rA, whereas EA is uniformly distributed in a larger sphere with the typical radius of an E. coli cell rA = R = 0.79 μm, we set N1 = NB, and the combined density of E1 and EB is set at the dense-packing limit nmax = 25 mM. (g) Efficiency fractions xA = εA/(εA + εB),xB = εB/(εA + εB) of the two branches of the pathway as functions of the fraction NB/(NA + NB) of enzyme EB, for the colocalized case in f and for the delocalized case where E1,EA and EB are uniformly distributed in a sphere of radius rA = R = 0.79 μm. In both cases the number of EA molecules is fixed to NA = 2,000 enzymes, and the catalytic constants for E1,EA,EB, that is, the values of kcat/KM for CarB, ArgI and PyrB, respectively, are k1 =5.3 ×10⁴ liter/s/mol (ref. 35), kA = 4.3 ×10⁷ liter/s/mol (ref. 36), kB = 4.8 × 10⁷ liter/s/mol (refs. 30,37). Other parameters are as given in Online Methods: Model parameters.
Figure 5
Figure 5
Phase-bright clusters and arginine pseudoauxotrophy increase with increasing CarB-PyrB overexpression. (a) Cell density with inducible CarB-PyrB expression as a function of time for different levels of anhydrotetracyline (aTc) inducer concentration and in different media: in minimal conditions, in the presence of additional arginine, additional uracil and both additional arginine, and additional uracil. Mean of Nreplicates = 4 plotted. (b,c) Phase images (b) (scale bars, 5 μm) and quantification (c) of phase-bright foci as functions of aTc inducer concentration. Number of phase-bright spots per cell followed an exponential distribution. Mean and 95% confidence intervals are shown as the s.e.m. (N0 nM = 760, N0.5 nM = 632, N5 nM = 317).
Figure 6
Figure 6
Ratio between the efficiency εA in the colocalized case and the efficiency εA in the delocalized case as a function of the fraction NB/(NA +NB ) of enzyme EB for the two-step metabolic pathway with a branch point for the same geometry and parameters as in Figure 4.

References

    1. James CL, Viola RE. Production and characterization of bifunctional enzymes. Substrate channeling in the aspartate pathway. Biochemistry. 2002;41:3726–3731. - PubMed
    1. Dunn MF, et al. The tryptophan synthase bienzyme complex transfers indole between the alpha and beta sites via a 25–30 ANG long tunnel. Biochemistry. 1990;29:8598–8607. - PubMed
    1. Huang X, Holden HM, Raushel FM. Channeling of substrates and intermediates in enzyme-catalyzed reactions. Annu Rev Biochem. 2001;70:149–180. - PubMed
    1. Welch GR. On the role of organized multienzyme systems in cellular metabolism: A general synthesis. Prog Biophys Mol Biol. 1978;32:103–191. - PubMed
    1. Bernhard SA, Srivastava DK. Direct transfer of metabolites via enzyme-enzyme complexes: evidence and physiological significance. NATO ASI Series. 1987;127:143–163.

Publication types

MeSH terms