. 2014 Nov;17(11):1518-27.
doi: 10.1038/nn.3815. Epub 2014 Sep 28.

Modulation of oligodendrocyte generation during a critical temporal window after NG2 cell division

Affiliations

Modulation of oligodendrocyte generation during a critical temporal window after NG2 cell division

Robert A Hill et al. Nat Neurosci. 2014 Nov.

Abstract

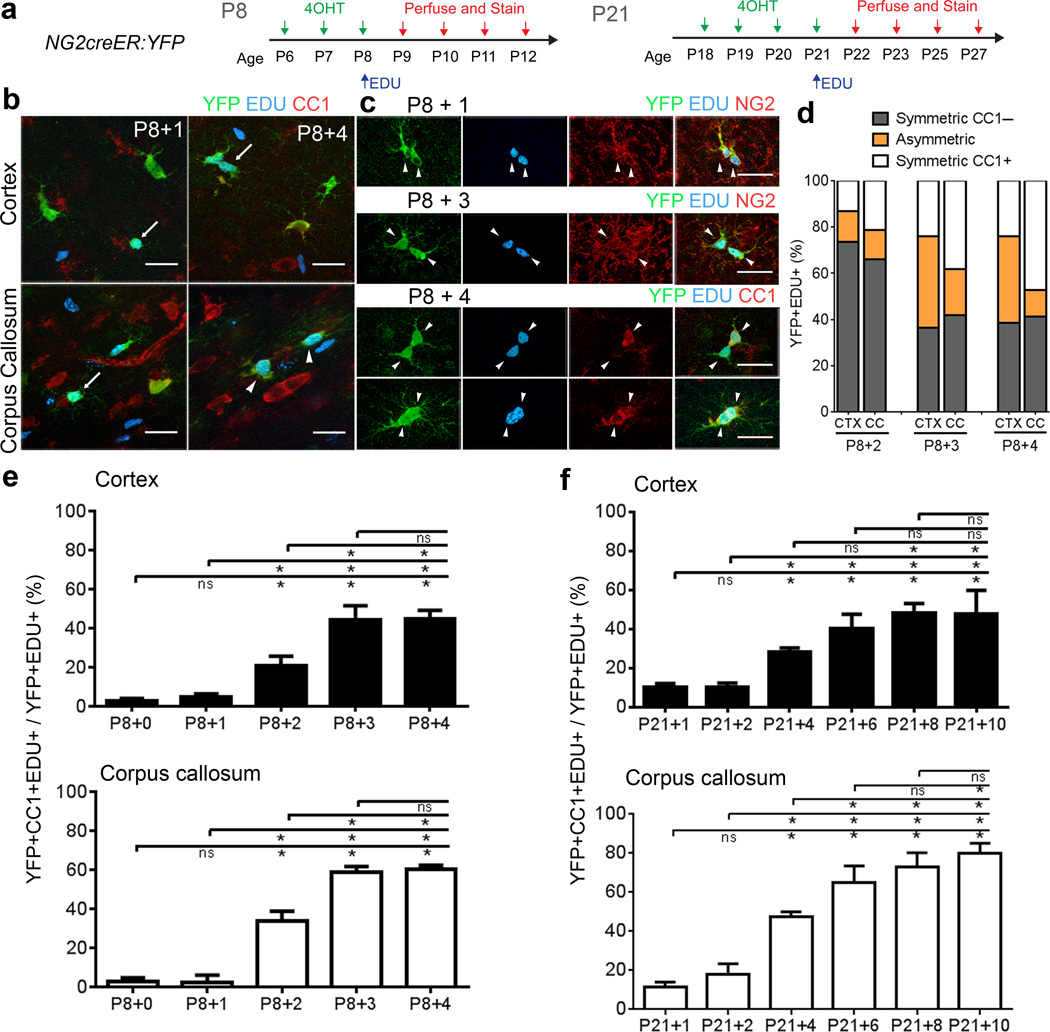
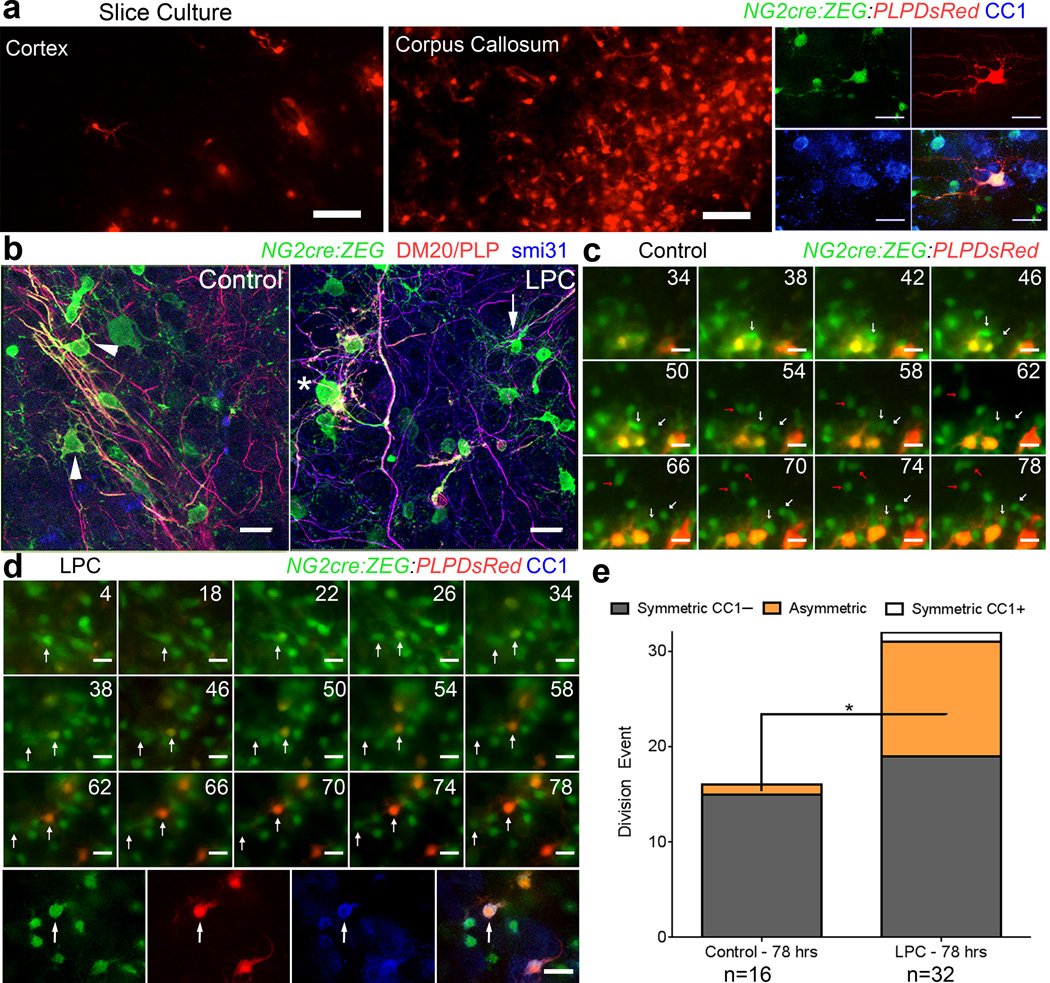
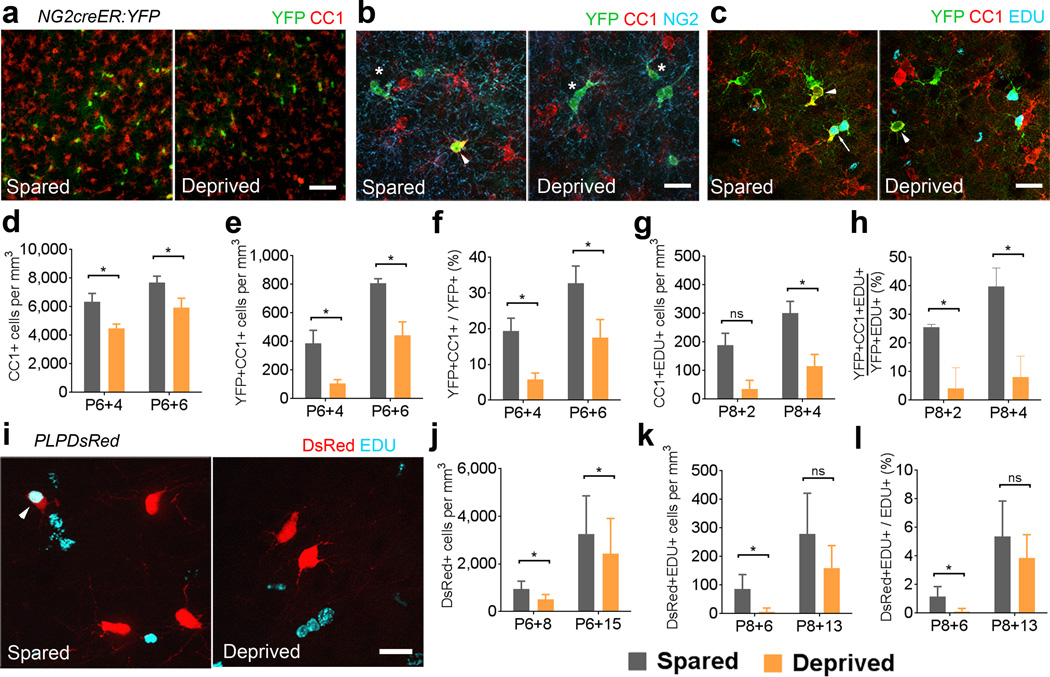
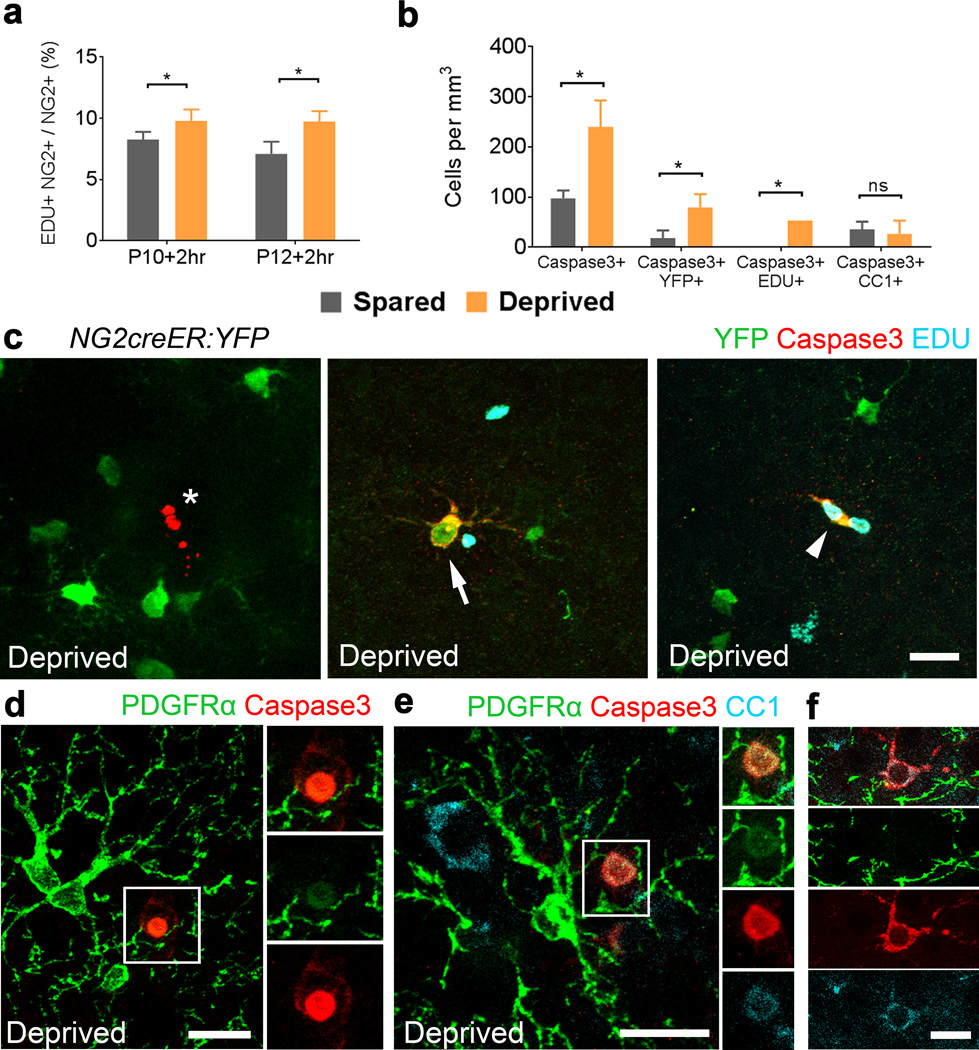
Oligodendrocytes in the mammalian brain are continuously generated from NG2 cells throughout postnatal life. However, it is unclear when the decision is made for NG2 cells to self-renew or differentiate into oligodendrocytes after cell division. Using a combination of in vivo and ex vivo imaging and fate analysis of proliferated NG2 cells in fixed tissue, we demonstrate that in the postnatal developing mouse brain, the majority of divided NG2 cells differentiate into oligodendrocytes during a critical age-specific temporal window of 3-8 d. Notably, within this time period, damage to myelin and oligodendrocytes accelerated oligodendrocyte differentiation from divided cells, and whisker removal decreased the survival of divided cells in the deprived somatosensory cortex. These findings indicate that during the critical temporal window of plasticity, the fate of divided NG2 cells is sensitive to modulation by external signals.


Figures

Figure 1
Figure 1. Temporal dynamics of oligodendrocyte differentiation after NG2 cell division in vivo
(a) Experimental protocol for EDU pulse-chase labeling in P8 and P21 NG2creER:YFP mice. (b) Labeling for YFP, EDU, and CC1 at 1 and 4 days after EDU injection. Arrows: YFP+EDU+CC1- cells, Arrowheads: YFP+EDU+CC1+ cells. (c) YFP+EDU+ cortical cell pairs immunostained for NG2 or CC1. Scale Bars in b–e 25μm. (d) The proportion of symmetric CC1– (two CC1–cells), symmetric CC1+ (two CC1+ cells), or asymmetric (one CC1+ and one CC1–cell) divisions in the cortex (CTX) and corpus callosum (CC) 2, 3 and 4 days after EDU injection. (e) Percentage of YFP+EDU+ cells that were CC1+ at the indicated days after EDU injection at P8. Cortex 0→2 *p=0.0002, t=5.554, 0→3 *p<0.0001, t=12.92, 0→4 *p<0.0001, t=13.04, 1→2 *p=0.0008, t=4.946, 1→3 *p<0.0001, t=12.32, 1→4 *p<0.0001, t=12.43, 2→3 *p<0.0001, t=7.370, 2→4 *p<0.0001, t=7.483; Corpus Callosum 0→2 *p<0.0001, t=9.639, 0→3 *p<0.0001, t=17.34, 0→4 *p<0.0001, t=17.73, 1→2 *p<0.0001, t=9.800, 1→3 *p<0.0001, t=17.50, 1→4 *p<0.0001, t=17.89, 2→3 *p<0.0001, t=7.701, 2→4 *p<0.0001, t=8.094. (f) Percentage of YFP+EDU+ cells that were CC1+ after EDU injection at P21. Cortex 1→4 *p=0.0269, t=3.427, 1→6 *p<0.0001, t=6.616, 1→8 p<0.0001, t=7.277, 1→10 *p<0.0001, t=7.160, 2→4 *p=0.0281, t=3.410, 2→6 *p<0.0001, t=6.597, 2→8 *p<0.0001, t=7.261, 2→10 *p<0.0001, t=7.143, 4→8 *p=0.0086, t=3.850, 4→10*p=0.0119, t=3.733; Corpus Callosum 1→4 *p<0.0001, t=6.868, 1→6 *p<0.0001, t=11.77, 1→8 *p<0.0001, t=11.73, 1→10 *p<0.0001, t=13.09, 2→4 *p<0.0001, t=5.619, 2→6 *p<0.0001, t=10.33, 2→8 *p<0.0001, t=10.48, 2→10 *p<0.0001, t=11.84, 4→6 *p=0.0088, t=3.843, 4→8 *p=0.0005, t=4.862, 4→10 *p<0.0001, t=6.226, 6→10 *p=0.0333, t=3.346. n=3 mice per group and genotype. Error Bars = SD. (*two-way ANOVA, Bonferroni post test).
Figure 2
Figure 2. NG2cre:ZEG:PLPDsRed triple transgenic mice identify cells at distinct stages of oligodendrocyte differentiation
(a) Low magnification images taken from the forebrain of fixed tissue from P15 NG2cre:ZEG:PLPDsRed transgenic mice. (b–d) High magnification images taken from P15 corpus callosum immunostained for NG2 (b), PDGFRα (c) or CC1 (d) showing DsRed fluorescence in a subpopulation of CC1+ cells (arrowheads) but not in NG2 cells that are NG2+ or PDGFRα+. (e) High magnification image of a DsRed+ oligodendrocyte in the corpus callosum showing typical myelinating oligodendrocyte morphology with multiple parallel processes. (f) Example of a cortical GFP+DsRed+ cell that is also CC1+. (g) Low magnification images of DsRed expression at P10, P15 and P30 in the cortex (layers I–VI) and corpus callosum (CC) showing the increase in the density of DsRed expressing oligodendrocytes during the first month of postnatal development. Scale bars 100 μm and 50 μm in a, 25μm in b–d and 250μm in g. (h) Quantification in PLPDsRed transgenic mice demonstrating that DsRed+ cells represent a minor subset of CC1+ cells in the cerebral cortex and corpus callosum. Error bars = SD.
Figure 3
Figure 3. Longitudinal in vivo imaging of cortical NG2 cells
(a) Example in vivo two-photon image captured with 975nm laser excitation from a P25 NG2cre:ZEG:PLPDsRed triple transgenic mouse. (b) Image captured in vivo from the somatosensory cortex of an NG2cre:ZEG transgenic mouse intravenously injected with Texas Red dextran to visualize the cortical vasculature showing the distinction and identification of GFP+ (green) NG2 cells (arrowheads) and vascular pericytes (arrows). Scale Bar = 50μm. (c) Montage of images of the same GFP+ NG2 cells captured daily from P20–P31, showing two cell divisions (arrows) over the imaging period. Scale Bar = 20μm. (d) Montage of images captured from P21–P30 showing individual GFP+ cells dividing (arrows) and then disappearing (red X) or migrating out of the field of view (blue O) 4 days after division Scale Bar = 20μm. (e) The density of GFP+ cells from P22–P31 by cortical depth. (f) Graph showing the distance between individually divided GFP+ cell pairs one day after cell division. (g) Cell separation trajectories of a subset of imaged GFP+ cell divisions depicting the distance between divided cells over the imaging period. (h) Example images of four types of division angles relative to brain orientation, with dotted line indicating division plane and time of division. Scale Bar = 10 μm. Quantification of each type of division from 86 cell division events.
Figure 4
Figure 4. In vivo imaging of oligodendrocyte differentiation
(a) Two-photon fluorescence image captured in vivo from the somatosensory cortex from a P35 NG2cre:ZEG:PLPDsRed transgenic mouse showing GFP+ NG2 cells, GFP+ oligodendrocytes, and GFP+ DsRed+ mature oligodendrocytes. Scale Bar = 50μm. (b) High magnification in vivo image of a single DsRed+ oligodendrocyte showing the distinctive morphology of a mature oligodendrocyte. Scale bar = 20μm. (c) Time-lapse sequence from P21–P30 showing dividing GFP+ cells (red arrows) and other GFP+ cells gradually becoming DsRed+ (blue arrows), but no GFP+ cell dividing and becoming DsRed+. Scale Bars = 50μm. (d) The density of GFP+DsRed+ cells appearing from P22–P31.
Figure 5
Figure 5. The temporal dynamics of oligodendrocyte differentiation are altered by myelin damage
(a) Images taken from control NGcreZEG:PLPDsRed slice cultures at the end of time-lapse imaging, showing DsRed expression in the cortex and corpus callosum, and an example of a GFP+DsRed+ gray matter oligodendrocyte expressing CC1 after post hoc immunostaining. Scale Bars = 50 μm top 25 μm bottom (b) Control and LPC -treated NG2cre:ZEG slices fixed at the beginning of time lapse imaging (31 hours after demyelination) and immunostained for DM20 (red) and phosphorylated neurofilaments (blue) showing relatively normal appearing GFP+DM20/PLP– cells (arrow) and GFP+DM20/PLP+ oligodendrocytes in LPC-exposed slices with degenerated processes (asterisk) compared with robust parallel processes extending along axons seen in control conditions (arrowheads), images from corpus callosum. Scale Bars = 20 μm. (c) Montage of images from a control slice showing GFP+ (green) gray matter cells (arrows) dividing but not becoming DsRed+ (red) over the 78-hour imaging period (hours indicated in top right corner of each panel). Scale Bar = 20 μm. (d) Images captured over 78 hours after LPC treatment of cortical slice show a GFP+ gray matter NG2 cell (arrow) dividing and then differentiating and becoming DsRed+ 20 hours after division. Immunostaining after imaging demonstrated that the imaged GFP+DsRed+ cell was a CC1+ oligodendrocyte. Scale Bar = 20 μm. (e) Quantification from time-lapse imaging of control and LPC-treated slice culture showing a shift to asymmetric fate of divided GFP+ cells after LPC exposure. (*p = 0.0168, t = 2.815) unpaired Student’s t-test.
Figure 6
Figure 6. Whisker deprivation reduces oligodendrocyte generation in the somatosensory cortex
(a) Coronal sections through layer IV of spared and deprived somatosensory cortex immunostained for YFP and CC1. Scale bar = 50μm. (b) Layer IV immunostained for YFP, CC1 and NG2. Arrowhead: YFP+CC1+ cells. Asterisks: YFP+NG2+ cells. Scale bar = 25μm. (c) Layer IV labeled for YFP, CC1, and EDU. Arrow: YFP+CC1+EDU+ cell. Arrowheads: YFP+CC1+ cells. Scale bar = 25μm. (d) Comparison of the density of CC1+ cells between spared and deprived layer IV at P6+4 (*p=0.0079, t=11.18) and P6+6 (*p=0.0108, t=9.526). (e) The density of YFP+CC1+ cells in layer IV at P6+4 (*p=0.0213, t=6.748) and P6+6 (*p=0.0247, t=6.243). (f) The proportion of YFP+ cells that were CC1+ at P6+4 (*p=0.0227, t=6.474) and P6+6 (*p=0.0132, t=8.604). (g) The density of CC1+EDU+ cells at P8+2 (p=0.0505, t=4.281) and P8+4 (*p=0.0447, t=4.570) (h) The proportion of YFP+EDU+ cells that were CC1+ at P8+2 (*p=0.0273, t=5.944) and P8+4 (*p=0.0009, t=33.18). (i) Images of spared and deprived somatosensory cortex of PLPDsRed mice showing EDU labeling and DsRed fluorescence. Scale bar = 25μm (j) Density of DsRed+ cells in PLPDsRed mice at P6+8 (*p=0.0074, t=6.523) and P6+15 (*p=0.0120, t=5.469). (k) The density of DsRed+EDU+ cells at P8+6 (*p=0.0248, t=4.324) and P8+13 (p=0.0582, t=2.987). (l) The proportion of EDU+ cells that were also DsRed+ at P8+6 (*p=0.0231, t=4.301) and P8+13 (p=0.0937, t=2.426). *paired Student’s t-test. Error bars = SD. n=3 or 4 mice per age group.
Figure 7
Figure 7. Whisker sensory deprivation increases apoptosis of divided NG2 cells
(a) The proportion of EDU+ NG2+ cells in spared and deprived somatosensory cortices after whisker clipping at P10 (*p=0.0379, t=4.986) and P12 (*p=0.0451, t=4.548). (b) Comparison of the density of Caspase-3+ (*p=0.0255, t=6.140), Caspase-3+YFP+ (*p=0.0192, t=7.115), Caspase-3+EDU+ (*p=0.0000) and Caspase-3+CC1+ (p=0.7359, t=0.3872) cells in spared and deprived cortices of NG2creER:YFP mice. (c) Example images from the deprived somatosensory cortex showing an unlabeled Caspase-3+ cell with typical apoptotic morphology (left, asterisk), a Caspase-3+ YFP+ cell (middle, arrow), and a Caspase-3+ EDU+ YFP+ cell (right, arrowhead). Scale bar = 20 μm. (d–f) Example images from deprived somatosensory cortex immunostained for PDGFRα, Caspase-3 and CC1. Scale bars = 20μm. *paired Student’s t-test. Error bars = SD. n=3 mice per age group.

References

    1. Nishiyama A, Komitova M, Suzuki R, Zhu X. Polydendrocytes (NG2 cells): multifunctional cells with lineage plasticity. Nat. Rev. Neurosci. 2009;10:9–22. - PubMed
    1. Hill RA, Nishiyama A. NG2 cells (polydendrocytes): Listeners to the neural network with diverse properties. Glia. 2014;62:1195–1210. - PMC - PubMed
    1. Dimou L, Simon C, Kirchhoff F, Takebayashi H, Gotz M. Progeny of Olig2-expressing progenitors in the gray and white matter of the adult mouse cerebral cortex. J. Neurosci. 2008;28:10434–10442. - PMC - PubMed
    1. Kang SH, Fukaya M, Yang JK, Rothstein JD, Bergles DE. NG2+ CNS glial progenitors remain committed to the oligodendrocyte lineage in postnatal life and following neurodegeneration. Neuron. 2010;68:668–681. - PMC - PubMed
    1. Rivers LE, et al. PDGFRA/NG2 glia generate myelinating oligodendrocytes and piriform projection neurons in adult mice. Nat. Neurosci. 2008;11:1392–1401. - PMC - PubMed

Publication types

MeSH terms