Review
. 2014 Sep;19(5):426-41.
doi: 10.1111/anec.12193.

Negative T wave in ischemic heart disease: a consensus article

Affiliations
Review

Negative T wave in ischemic heart disease: a consensus article

Antonio Bayés de Luna et al. Ann Noninvasive Electrocardiol. 2014 Sep.

Abstract

Background: For many years was considered that negative T wave in ischemic heart disease represents ischemia and for many authors located in subepicardial area.

Methods: We performed a review based in the literature and in the experience of the authors commenting the real significance of the presence of negative T wave in patients with ischemic heart disease.

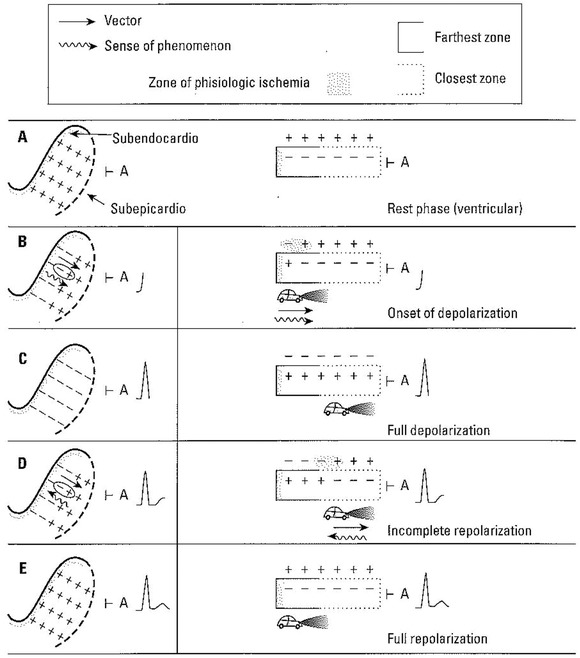
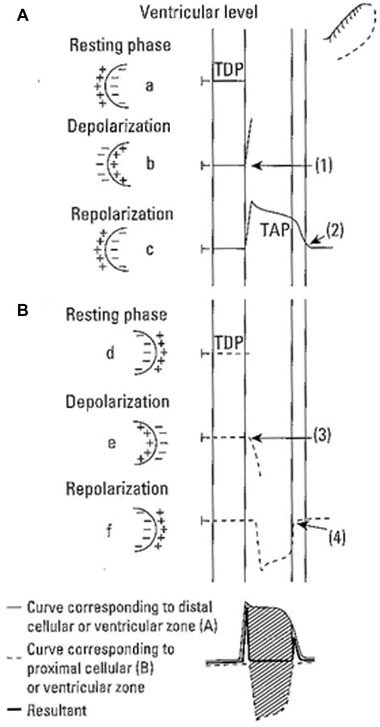
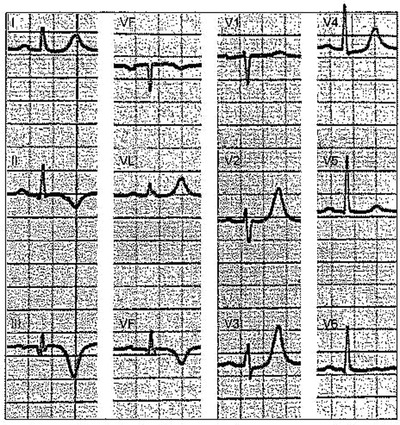
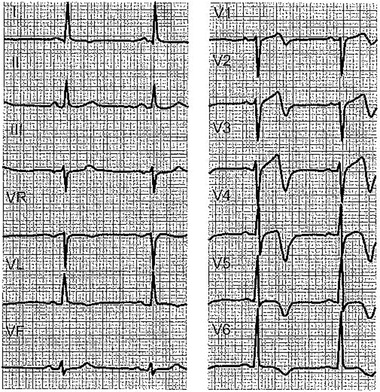
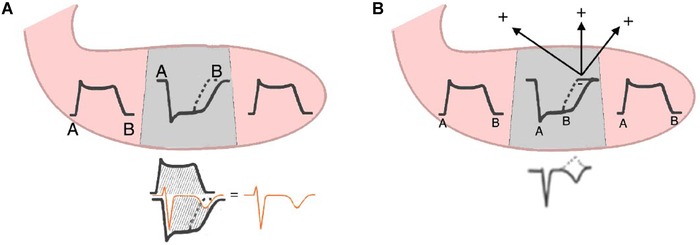
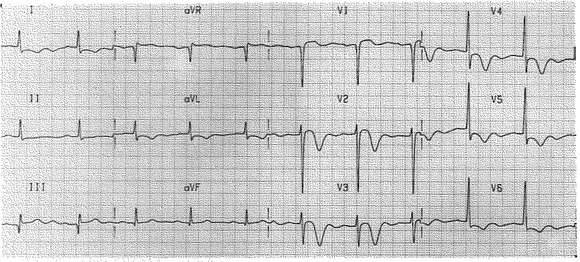
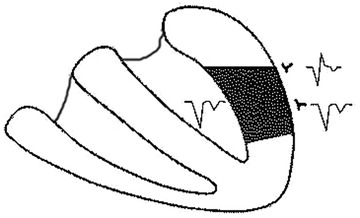
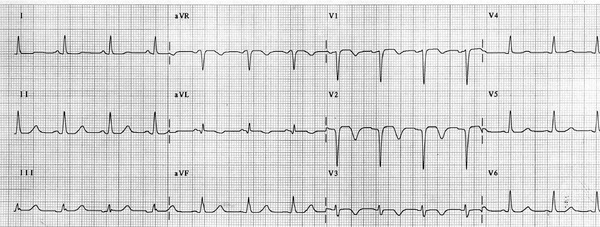
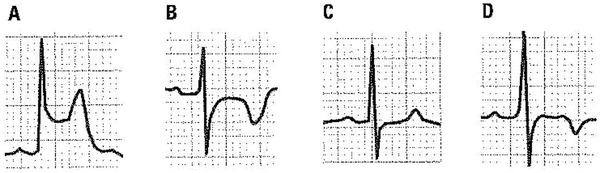
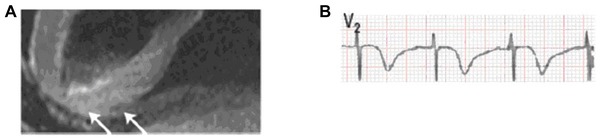
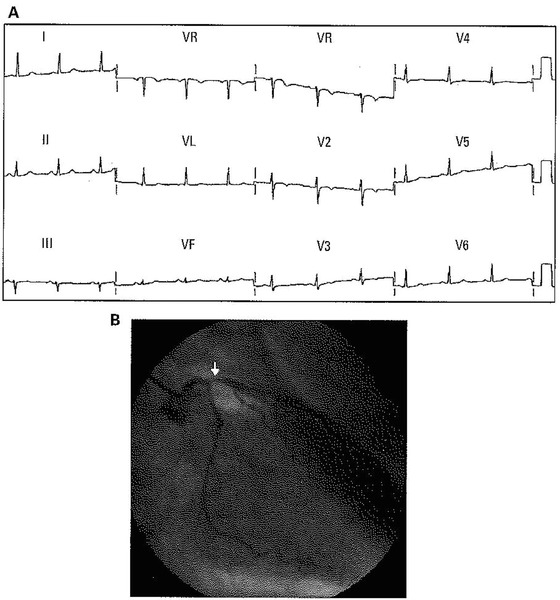
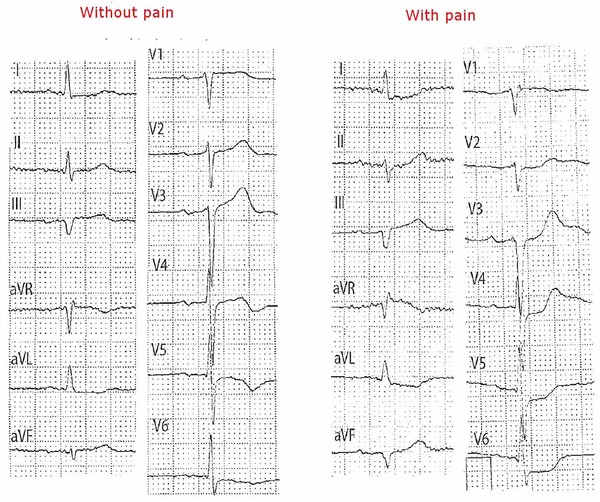
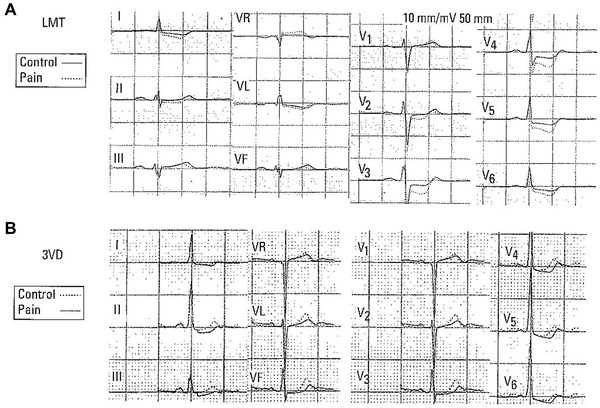
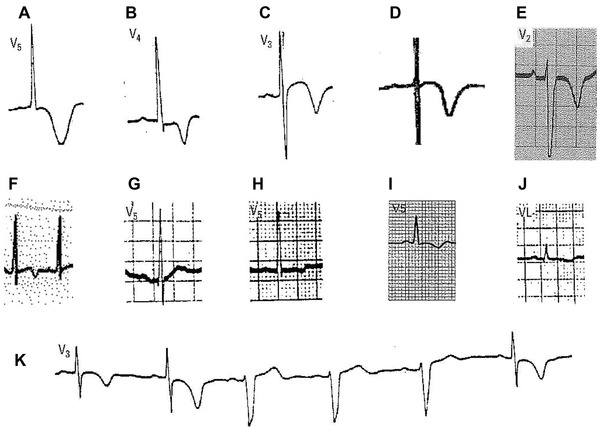
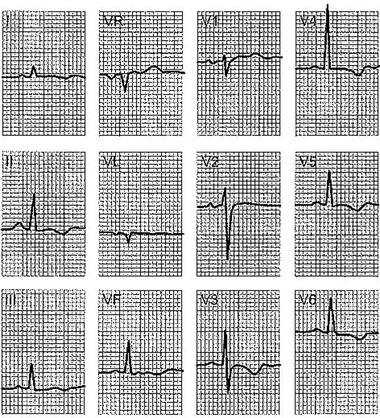
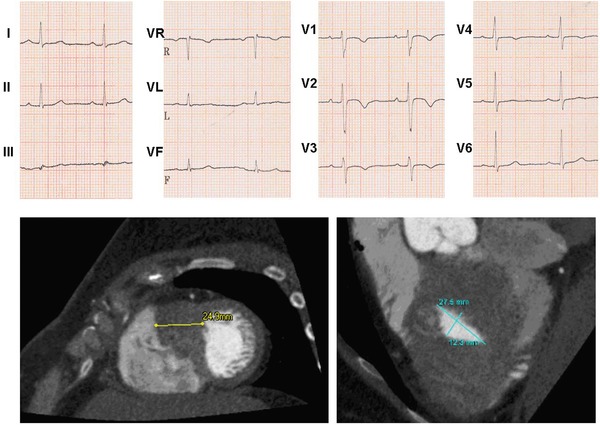
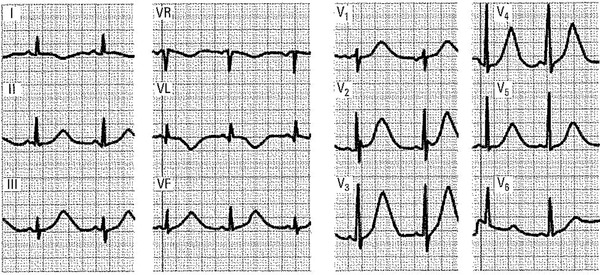
Results: The negative T wave may be of primary or secondary type. Negative T wave observed in ischemic heart disease are of primary origin, therefore not a consequence of abnormal repolarization pattern. The negative T wave of ischemic origin presents the following characteristics: (1) are symmetrical and of variable deepness; (2) present mirror patterns; (3) starts in the second part of repolarization; and (4) may be accompanied by positive or negative U wave. The negative T wave of ischemic origin may be seen in the following clinical settings: (1) postmyocardial infarction due to a window effect of necrotic zone and (2) as a consequence of reperfusion in case of aborted MI when the artery has opened spontaneously, or after fibrinolysis, PCI, or coronary spasm.

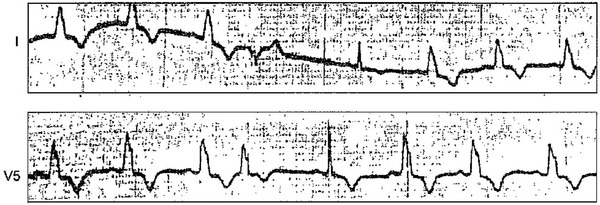
Conclusion: Acute ongoing ischemia do not cause negative T wave. This pattern appears when the ongoing ischemia is vanishing or in the chronic phase. In all these cases the cause of negative T wave is not located in the subepicardial area. Furthermore, positive exercise testing is expressed by ST depression never by isolated negative T wave. There are many circumstances that may present negative T wave outside ischemic heart disease and that have been discussed in this paper.

Keywords: electrocardiography; ischemic heart disease; negative T wave.


Figures

Figure 1
Figure 1
Diagram of the depolarization (QRS) and repolarization (T) morphologies in the normal human heart. The figures to the left show a view of the free left ventricular wall from above, and we see only the distribution of the charges on the external surface of this “enormous left ventricular cell.” In the right column we see a lateral view in which the changes in the electrical charges can be appreciated. With electrode A in the epicardium, a normal ECG curve is recorded.
Figure 2
Figure 2
At ventricular level, the sum of the transmembrane action potential (TAP) from the area distal (A) to the electrode and the TAP from the area proximal (B) to the electrode originates the human (ventricular) ECG with positive T waves. TDP = transmembrane diastolic potential.
Figure 3
Figure 3
Recording in the case of experimental occlusion of left anterior descending (LAD) coronary artery in a dog with open heart. (A) Control. (B) ECG pattern of ischemia (negative T wave). (C) ECG pattern of injury (ST segment elevation). (D) Appearance of ECG pattern of necrosis (Q wave; Adapted with permission from Bailey et al. 1943)
Figure 4
Figure 4
Electrocardiographic–pathological correlations after the occlusion of a coronary artery in an experimental animal with its thorax closed. (A) Control. (B) It changes from a subendocardial ischemia pattern (tall and peaked T wave) to a pattern of an ST segment elevation when the acute clinical ischemia is more severe and transmural (C). Finally (4), the “Q” wave of necrosis develops, accompanied as time passes by an increasingly evident pattern of negative T wave (Adapted with permission from Lengyel et al. 1957).
Figure 5
Figure 5
Chronic myocardial infarction of inferolateral zone. ECG with a typical pattern of negative T wave seen in post ischemic phase in the leads facing the inferior wall (negative and symmetric T wave in II, III, and VF) and the lateral wall (positive peaked T wave in V1–V2) as a mirror patterns. The R wave in V1 is not prominent as happens in cases of lateral wall MI affecting especially basal segments.
Figure 6
Figure 6
ECG with a quite negative T wave in V1–V2 to V5, with extension to I and VL in a patient with ACS, without chest pain, corresponding to a critical lesion in the proximal part of the left anterior descending (LAD) coronary artery, that practically normalizes during a chest pain crisis.
Figure 7
Figure 7
Origin of negative and deep T wave. (A) Due to increased TAP duration of transmural area affected, the sum of this TAP of this area with the TAP neighbor areas, that is shorter, explains the negative T wave. (B) The explanation based on the vector of ischemia, which is directed far away from recording electrode.
Figure 8
Figure 8
Representative electrocardiogram of concordant, negative T and negative U morphology. In leads I, aVL, V2–V6. (Taken from Reining et al.,28 with permissions of ANE 28).
Figure 9
Figure 9
The development of a necrosis Q wave when a transmural infarction with homogeneous involvement of the left ventricle exists may be explained because the necrotic tissue, which is nonactivable, acts as an electrical window and allows for the recording of the left ventricular intracavitary QRS (which is a QS complex) from outside. If the necrosis zone is not completely transmural but the rest of the wall is ackinetic, also all the wall may act as a window (see Tamura et al.29).
Figure 10
Figure 10
Typical pattern of negative T wave after reperfusion with fibrinolitic therapy, in case of STEACS due to occlusion of proximal LAD.
Figure 11
Figure 11
In 2010, the patient with STEMI (A) is submitted to successful PCI (B), and a postischemic negative T wave appears. Later on (C) the patient presented with pain again and the ECG pseudonormalizes. A new coronarography demonstrates thrombosis of the stent and new PCI solves the problem, and again a negative T wave appears (D). The infarction was aborted.
Figure 12
Figure 12
(A) Transmural involvement (CMR) in a case of negative T wave after aborted ACS. See the transmural edema B. Deep and negative T wave in V2 in a case of transient LAD occlusion (negative T wave of reperfusion edema; Taken from Migliore et al.33).
Figure 13
Figure 13
ECG of 55‐year‐old man without chest pain and with non‐ST segment elevation acute coronary syndrome (NSTEACS; unstable angina) and ECG with symmetric and mild negative T wave from V1 to V3. The coronarography shows important left anterior descending (LAD) proximal occlusion.
Figure 14
Figure 14
Patient with three vessel disease and left main trunk subocclusion. When recorded without pain, the ECG shows a negative T wave in V4–V6 of 2 mm. With pain, ST depression, which encompasses the T wave, clearly appears or increases in these leads and in the frontal plane lead.
Figure 15
Figure 15
(A and B) Changes of ST/T during angina crisis in case of left main trunk (LMT) subocclusion (A) and severe three‐vessel disease (B). See the differences in A and B before and after pain. It is evident, especially in LMT subocclusion, that the increase of ST depression is accompanied by negative or nearly negative final T wave.
Figure 16
Figure 16
(A) Wide negative T wave with long QT and isoelectric ST segment that sometimes is observed in stroke. Usually with mirror pattern in other leads (see Fig. 19). (B) Very deep and peaked negative T wave, with preceded by depressed ST segment. This pattern is very common in apical HCM. (C). Very deep negative T wave preceded by ST elevation seen in asymptomatic, apparently healthy tennis player. In this case, it is necessary to rule out HCM. (D) Wide and deep negative T wave, with long QT preceded by isoelectric ST segment seen in a patient with shock and hypomagnesemia. (E) Negative wide very deep T wave seen in an acute for cor pulmonale. (F) Transient mild negative T wave seen during exercise test in a case of hyperventilation. (G) Flat and bimodal T wave due to amiodarone use. (H) Mild negative T wave due to chronic alcohol intake. (I) Negative T wave in pericarditis (see Fig. 17). (J) Flat/negative T wave with low voltage of ORS seen in mixedema. (K) A typical case of negative T wave in case of intermittent left bundle branch block, due to electric memory.
Figure 17
Figure 17
Patient with chronic constrictive pericarditis. The T wave is negative in many leads, but not quite deep, without the “mirror pattern” in the frontal plane. The T wave is only positive in VR and V1 because, as there is a diffuse subepicardial ischemia, they are the only two leads in which the ischemic vector that is directed away from the ischemic area is approaching the exploring electrode.
Figure 18
Figure 18
ECG of young woman of 42 years, that presents a negative and symmetric T wave in V1–V3. Due to this morphology and in spite of apparently normal echocardiogram, CMR was performed, that shows a very huge increase of the wall of lower apical part of the heart, corresponding to an atypical form of hypertrophic CM.
Figure 19
Figure 19
A 30‐year‐old patient with subarachnoid hemorrhage. The ECG shows quite significant repolarization changes, with a very long QT interval mainly at the expense of a very wide T wave, positive in some leads (precordial and inferior leads) and negative in others (I, VL).
Figure 20
Figure 20
Symmetric negative T wave (see leads I and V5) in a patient with hypertension and intermittent complete left bundle branch block, who presents with symmetric T wave when the LBBB disappears after a ventricular extrasystole (fifth Qr 25 complex I and V0). This is a mixed pattern (ischemia + LVH). Also the T wave of complexes with LBBB shows more symmetric morphology than in cases of isolated LBBB.

References

    1. Rosenbaum FF, Wilson FN, Johnston FD. The precordial electrocardiogram in high lateral myocardial infarction. Am Heart J 1946;32:135–151. - PubMed
    1. Burgess JM, Green LS, Millar D, et al. The sequence of normal ventricular recovery. Am Heart J 1972;84:660–169. - PubMed
    1. Ashman R, Hull E. Essentials of Electrocardiography. Macmillan Co. New York 1937.
    1. Burnes J, Waldo A, Rudy Y. Imaging dispersion of ventricular repolarization. Circulation 2001;104:1299–1305. - PubMed
    1. Franz MR, Bargheer K, Rafflenbeul W, Haverich A, Lichtlen PR. Monophasic action potential mapping in human subjects with normal electrocardigrams: Direct evidence of the T wave. Circulation 1987;75:379–386. - PubMed