
DNA copy number evolution in Drosophila cell lines

Hangnoh Lee et al. Genome Biol. .

Erratum in

  • Correction to: DNA copy number evolution in Drosophila cell lines.
    Lee H, McManus CJ, Cho DY, Eaton M, Renda F, Somma MP, Cherbas L, May G, Powell S, Zhang D, Zhan L, Resch A, Andrews J, Celniker SE, Cherbas P, Przytycka TM, Gatti M, Oliver B, Graveley B, MacAlpine D. Lee H, et al. Genome Biol. 2019 Mar 11;20(1):53. doi: 10.1186/s13059-019-1668-5. Genome Biol. 2019. PMID: 30857560 Free PMC article.

Abstract

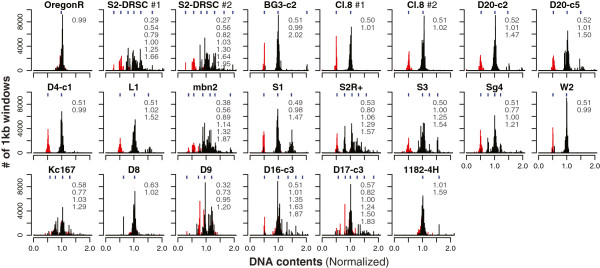
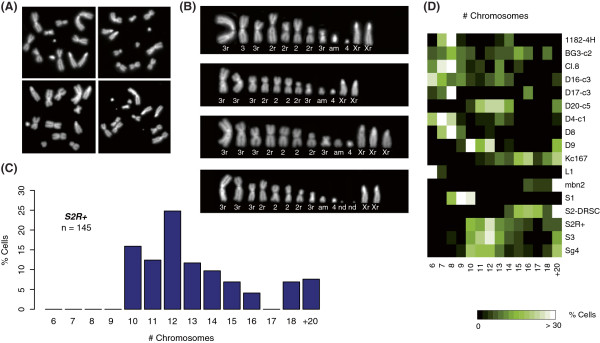
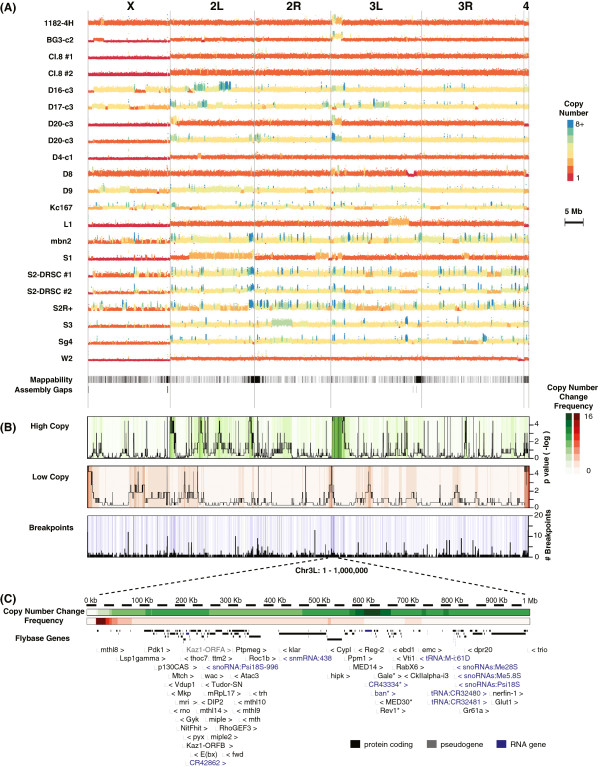
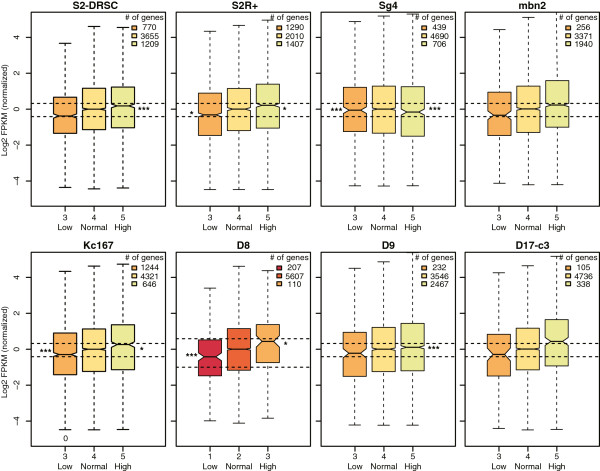
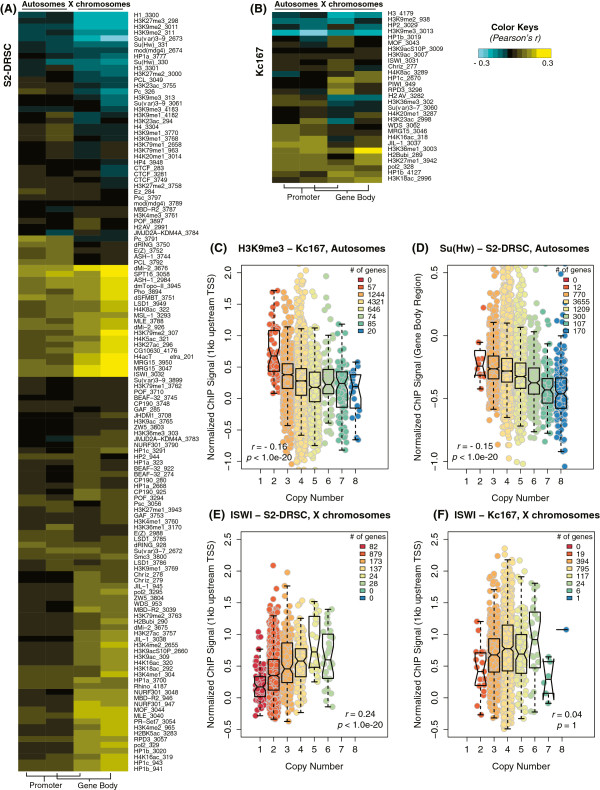
Background: Structural rearrangements of the genome resulting in genic imbalance due to copy number change are often deleterious at the organismal level, but are common in immortalized cell lines and tumors, where they may be an advantage to cells. In order to explore the biological consequences of copy number changes in the Drosophila genome, we resequenced the genomes of 19 tissue-culture cell lines and generated RNA-Seq profiles.

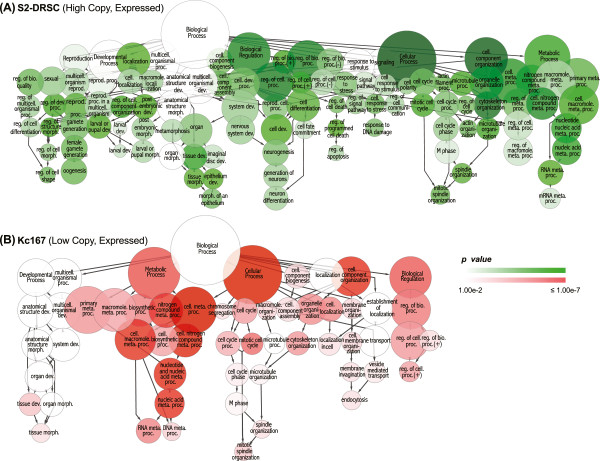
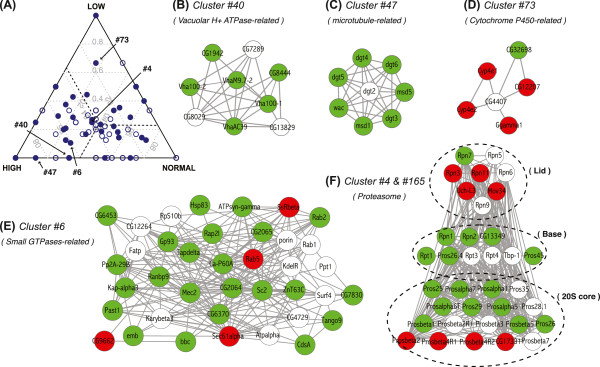
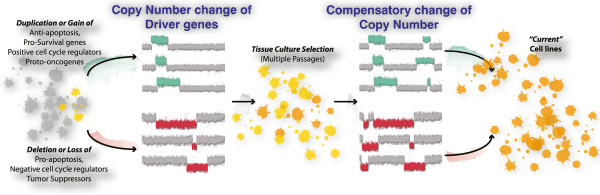
Results: Our work revealed dramatic duplications and deletions in all cell lines. We found three lines of evidence indicating that copy number changes were due to selection during tissue culture. First, we found that copy numbers correlated to maintain stoichiometric balance in protein complexes and biochemical pathways, consistent with the gene balance hypothesis. Second, while most copy number changes were cell line-specific, we identified some copy number changes shared by many of the independent cell lines. These included dramatic recurrence of increased copy number of the PDGF/VEGF receptor, which is also over-expressed in many cancer cells, and of bantam, an anti-apoptosis miRNA. Third, even when copy number changes seemed distinct between lines, there was strong evidence that they supported a common phenotypic outcome. For example, we found that proto-oncogenes were over-represented in one cell line (S2-DRSC), whereas tumor suppressor genes were under-represented in another (Kc167).

Conclusion: Our study illustrates how genome structure changes may contribute to selection of cell lines in vitro. This has implications for other cell-level natural selection progressions, including tumorigenesis.


Figures

Figure 1
Figure 1
Cell line ploidy by DNA-Seq. Histograms of normalized DNA read density of 1 kb windows. Red, reads from X chromosomes; black, reads from autosomes; blue, centers of individual peak clusters; gray, peak cluster ratios. #1 and #2 indicate the results from two independent sets of DNA-Seq from different labs.
Figure 2
Figure 2
Karyotypes. (A,B) Metaphase spread figures of S2R + cells (A) and as aligned in karyograms (B). Either wild-type, or close to wild-type chromosome 2 s and 3 s are designated with ‘2’ and ‘3’. If rearrangements were found on them, such as deletions, inversion or translocations, they are marked with ‘r’ (2r and 3r). Small chromosomes that carried euchromatic material appended to a centromeric region that was likely to derive from a large autosome are labeled as ‘am’. Chromosomes whose origin could not be determined are labeled ‘nd’. (C) Chromosome numbers in metaphases from 145 S2R + cells. (D) A heatmap summarizing chromosome numbers. Metaphase spreads for all the cell lines are provided in Additional file 1.
Figure 3
Figure 3
DNA copy numbers. (A) Plots of mapped DNA read density along the genome. Deduced copy number is indicated by color (see key). (B) Heatmaps display how many cell lines have increased (green) or decreased (red) copy number. Black lines in the first two rows show significance. Blue lines indicate breakpoints. Black in the bottom row shows the number of breakpoints shared by the 19 cell lines. (C) A zoomed-in map of the sub-telomeric region (1 Mb) of chromosome 3 L. Asterisks: genes within the highly duplicated regions. Genes with little or no functional information (‘CG’ names) were omitted for brevity.
Figure 4
Figure 4
Copy number and expression. RNA-Seq analysis of S2-DRSC, S2R+, Sg4, mbn2, Kc167, D8, D9 and D17-c2 cells. Boxplots show interquartile ranges of the distribution of FPKM (fragments per kilobase per million reads) values of expressed genes (FPKM >1) for different copy number classes in the indicated lines. The number of genes in each class is shown. All FPKM values are centered to have the median of normal copy number gene expression as 0. Top, middle, and bottom lines of boxes correspond to upper quartile (Q3), median, and lower quartile (Q1) in the distribution, respectively. Notches show the 95% confidence interval of each median. Whiskers indicate the maximum, or minimum, value that is still within 1.5 times of interquartile distance (Q3 - Q1) from Q3 or Q1, respectively. Horizontal dashed lines indicate the expected FPKM values based on a one-to-one relationship between gene dose and expression. Asterisks display P-values, determined by Mann-Whitney U test (*P < 0.05, **P < 0.01, ***P < 0.001).
Figure 5
Figure 5
Copy numbers and chromatin immunoprecipitation. (A,B) A heatmap that summarizes correlation between copy numbers and chromatin immunoprecipitation (ChIP) signals of expressed genes in S2-DRSC (A) or Kc167 (B) cell lines. Target proteins for ChIP and modENCODE submission numbers are listed (right side). Columns show autosomal promoter regions (1 kb upstream of transcription start) and gene body regions as indicated. (C,D) ChIP signals of H3K9me2 (C) and SU(HW) (D) at autosome gene bodies are displayed against different copy number classes as boxplots (S2-DRSC cells). Top, middle, and bottom lines of boxes for upper quartile, median, and lower quartile points, respectively. Notches indicate the 95% confidence interval of each median and whiskers display the maximum, or minimum, value within the range of 1.5 times of interquartile distance, respectively. Dots display individual genes within different copy number classes. Pearson’s correlation for r and its significance (P-value). (E,F) ISWI ChIP signal analyzed for X chromosome gene bodies in a male (S2-DRSC; E) and a female (Kc167; F) cell line. TSS, transcription start site.
Figure 6
Figure 6
Gene Ontology and copy number in S2-DRSC and Kc167 cells. (A) ‘Biological processes’ sub-ontology of overrepresented genes in S2-DRSC cells as a hierarchical structure. Circle size corresponds to relative enrichment of the term in GO categories. Circle colors represent P-values (Holm-Bonferroni corrected hypergeometric test). (B) GO enrichment of genes in low copy number segments of Kc167 cells. Please note that both S2-DRSC low and Kc167 high copy number genes are not significantly enriched in specific GO categories.
Figure 7
Figure 7
Copy number and physical interaction networks. (A) A ternary plot that displays fractions of high, normal, and low copy number genes that encode complexes in Drosophila protein-protein interaction networks. Each point corresponds to a protein complex or a cluster. Distances from the three apexes in the triangle indicate fraction of cluster members from a given copy number class. Dashed lines indicate expected portion of each copy number class based on a random distribution of S2R + cell line copy numbers. Complexes where copy number composition is significantly different from the expected ratio (P < 0.05, hypergeometric test) are filled in blue. (B-F) Protein interaction networks described and labeled in (A). Green, high copy gene products; red, low; white, normal. For (F), six proteins whose associations with the proteasome parts are not clear in the literature were omitted.
Figure 8
Figure 8
A schematic model of copy number evolution. At an early stage of cell line establishment, cells that acquired ‘advantageous’ copy number changes would be selected due to the dosage effect of potential driver genes. We suggest that these included increased copy number for anti-apoptosis, or pro-survival genes as well as decreased copy number of pro-apoptotic or tumor suppressor genes. Further culture passages selected cells with more optimized genome structure that restored genic stoichiometric imbalance caused by drivers and especially passenger copy number changes.

References

    1. Torres EM, Williams BR, Amon A. Aneuploidy: cells losing their balance. Genetics. 2008;179:737–746. - PMC - PubMed
    1. Disteche CM. Dosage compensation of the sex chromosomes. Annu Rev Genet. 2012;46:537–560. - PMC - PubMed
    1. Spradling AC. The organization and amplification of two chromosomal domains containing Drosophila chorion genes. Cell. 1981;27:193–201. - PubMed
    1. Ashburner M, Golic K, Hawley RS. Drosophila: a Laboratory Handbook. 2. Cold Spring Harbor, New York: Cold Spring Harbor Lab; 2011. Chromosomes; pp. 39–44.
    1. Herrmann M, Trenzcek T, Fahrenhorst H, Engels W. Characters that differ between diploid and haploid honey bee (Apis mellifera) drones. Genet Mol Res. 2005;4:624–641. - PubMed

Publication types