. 2014 Dec;1844(12):2241-50.
doi: 10.1016/j.bbapap.2014.09.016. Epub 2014 Sep 28.

Novel microscale approaches for easy, rapid determination of protein stability in academic and commercial settings

Affiliations

Novel microscale approaches for easy, rapid determination of protein stability in academic and commercial settings

Crispin G Alexander et al. Biochim Biophys Acta. 2014 Dec.

Abstract

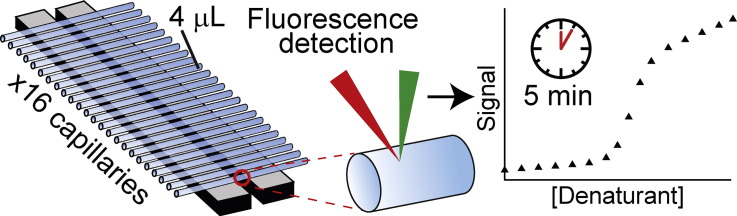
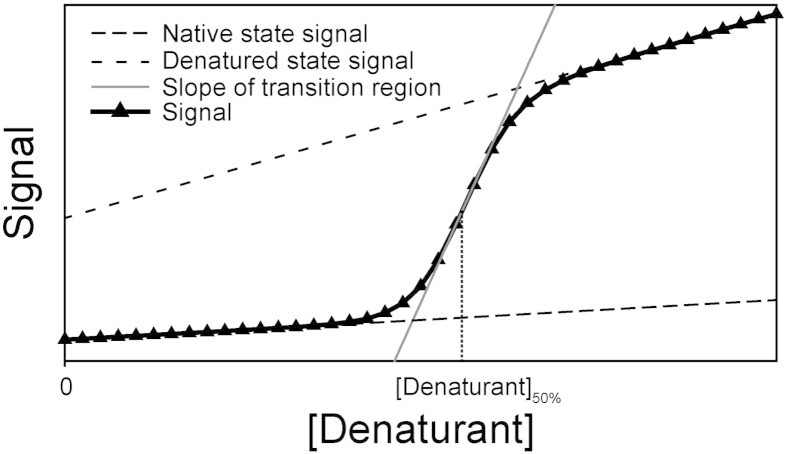
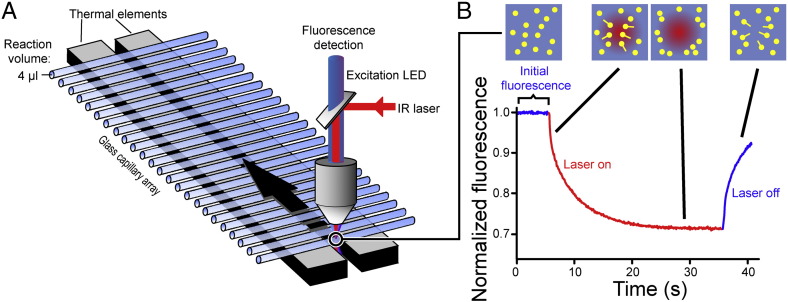
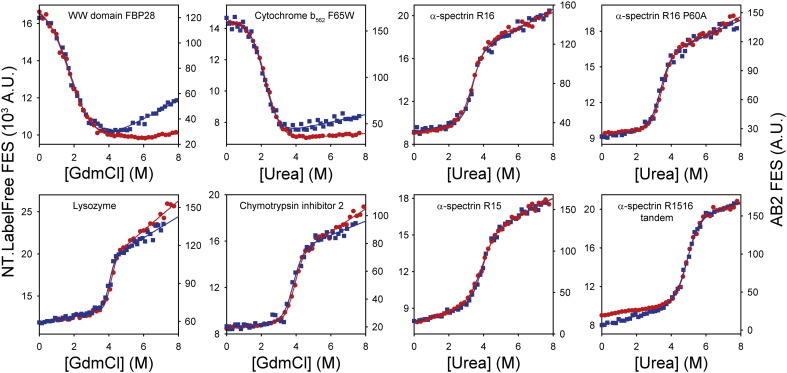
Chemical denaturant titrations can be used to accurately determine protein stability. However, data acquisition is typically labour intensive, has low throughput and is difficult to automate. These factors, combined with high protein consumption, have limited the adoption of chemical denaturant titrations in commercial settings. Thermal denaturation assays can be automated, sometimes with very high throughput. However, thermal denaturation assays are incompatible with proteins that aggregate at high temperatures and large extrapolation of stability parameters to physiological temperatures can introduce significant uncertainties. We used capillary-based instruments to measure chemical denaturant titrations by intrinsic fluorescence and microscale thermophoresis. This allowed higher throughput, consumed several hundred-fold less protein than conventional, cuvette-based methods yet maintained the high quality of the conventional approaches. We also established efficient strategies for automated, direct determination of protein stability at a range of temperatures via chemical denaturation, which has utility for characterising stability for proteins that are difficult to purify in high yield. This approach may also have merit for proteins that irreversibly denature or aggregate in classical thermal denaturation assays. We also developed procedures for affinity ranking of protein-ligand interactions from ligand-induced changes in chemical denaturation data, and proved the principle for this by correctly ranking the affinity of previously unreported peptide-PDZ domain interactions. The increased throughput, automation and low protein consumption of protein stability determinations afforded by using capillary-based methods to measure denaturant titrations, can help to revolutionise protein research. We believe that the strategies reported are likely to find wide applications in academia, biotherapeutic formulation and drug discovery programmes.

Keywords: Chemical denaturation; Ligand screening; Low protein consumption; Microscale thermophoresis; Thermal denaturation.


Figures

None
Graphical abstract
Fig. 1
Fig. 1
Chemical denaturation of a protein at equilibrium. Simulated 2-state denaturation induced by increasing the chemical denaturant concentration. The spectroscopic signal used to probe denaturation is typically sigmoidal (black triangles) and consistent with cooperative unfolding . In order to determine the fractional occupancy of native and denatured states, it is necessary to fit the slopes of pre- (native) and post-transition (denatured) baselines to linear functions (dashed lines). The ΔGD−N0 value can be easily determined by linear extrapolation once the transition midpoint ([Denaturant]50%) and mD–N values are known (see Eq. (1), see Section 1.1). mD–N correlates with the slope of the transition (grey line) and increases with protein size (Fig. S1b) .
Fig. 2
Fig. 2
Layout of the microscale thermophoresis instrument and measurement principles. (A) MST is measured in disposable capillaries that hold sample volumes of ~ 4 μl. The sample temperature is regulated by thermal elements which directly contact these capillaries. A focused IR laser induces a local temperature gradient in the sample (typically in the order of 2–6 K), triggering thermophoretic movement of molecules . Fluorescent molecules in the capillary are excited and detected through the same objective lens. (B) During an MST experiment, the fluorescence of molecules in solution (yellow dots) is detected over time. For simple FES experiments, detection of the initial fluorescence for 1–5 s is sufficient. During a typical MST experiment, the infrared laser is activated after 5 s, resulting in thermophoresis towards lower temperatures which can be quantified by measuring the fluorescence decay (in case of positive thermophoresis, as shown here), or fluorescence increases (negative thermophoresis). After a defined time, the infrared laser is switched off, resulting in re-equilibration of the solution by diffusion.
Fig. 3
Fig. 3
MST instruments yield comparable denaturant titrations to conventional fluorimeters. Changes in intrinsic fluorescence emission properties were recorded for chemical denaturant titrations of a range of different proteins (Table S1). Data were acquired using a standard AB2 fluorimeter (red circles, AB2 FES axis) and an NT.LabelFree instrument (blue squares, NT.LabelFree FES axis). The sigmoidal titrations were fitted to a function describing 2-state denaturation (red and blue lines, Eq. (3), Section 2.7) in order to determine [Denaturant]50%, mD–N and ΔGD−N0 (Table 2). Whilst MST instruments yielded titrations of similar quality to conventional spectrometers, the MST measurement strategy required only a fraction of the time, operator input and sample volumes (Table 1). For the majority of proteins tested here, the intrinsic fluorescence emission of the native state was more quenched than the corresponding denatured state. However, the reverse was true for E. coli cytochrome b562 F65W and the murine FBP28 WW domain. Consequently, the direction of the signal change accompanying the denaturation of these two proteins was inverted compared to the data for the other proteins shown here. This is an inherent property of these proteins and was independent of the instrument used.
Fig. 4
Fig. 4
Variance in replicate measurements of denaturant titrations. The variance in triplicate measurements of chemical denaturant titrations was determined (using an NT.LabelFree instrument) for the F65W mutant of E. coli cytochrome b562. The data shown is the average of three independent measurements with the standard deviation of measurements represented as error bars. The absolute variation between measurements was ~ 1–2%.
Fig. 5
Fig. 5
Thermophoresis can be a useful orthogonal probe of protein denaturation. (A) Thermophoresis values of HBc (green circles) identified equivalent transitions to those identified using far-UV CD spectroscopy (black triangles), consistent with thermophoresis being an orthogonal probe of protein denaturation. Data were fitted to a 3-state equilibrium transition with a populated intermediate as previously described . (B) Normalised thermophoresis time traces of SOD1 at a range of urea concentrations. A 3 K gradient was created between 5 and 35 s (‘Laser on’). SOD1 exhibited positive thermophoresis (i.e. it moved away from the higher temperature in the gradient) which caused an exponential decline of the fluorescence signal (Fig. 2). Denatured SOD1 (red lines) moved further than native protein (blue lines). There was a gradual transition from native to denatured protein, with both states being significantly populated at the transition midpoint (purple lines). Thermophoresis was reversible and the fluorescence signal returned to its initial value after the laser was switched off and the thermal gradient depleted. (C) Complementary techniques were used to probe chemical denaturation of SOD1. Thermophoresis values (green circles, derived from the data in b) yielded essential identical fitting parameters as far UV CD spectroscopy (black triangles). Under these conditions, no denaturation transition was evident using intrinsic fluorescence emission measured on the NT.LabelFree instrument (due to the wide bandpass emission filter in the NT.LabelFree instrument). All curves were fitted to Eq. (3) (see Section 2.7) which describes a two-state denaturation transition.
Fig. 6
Fig. 6
Wider applications for denaturant titrations. (A) Urea denaturation of the P60A R16 α-spectrin domain was probed between 295.7 and 318.2 K using fluorescence emission spectroscopy. The resultant titrations were fitted globally to a series of independent 2-state transitions with a shared mD–N value (see Section 2.7). This strategy allowed determination of [Denaturant]50% values at each temperature. (B) The parameters determined in (A) allowed the direct determination of ΔGD−N0 values at each temperature (black circles). The temperature dependence of ΔGD−N0 fitted well to a simple polynomial equation (dashed blue line) and a Gibbs–Helmholtz formalism (solid black line, see Section 2.7) . These fits were essentially identical and defined a Tm value (blue square) close to that obtained in thermal denaturation experiments probed by far-UV CD spectroscopy (red plus sign, inset) and differential scanning calorimetry (black cross, Fig. S5). (C) Assaying protein–peptide interactions using chemical denaturation. The PDZ1 F95W domain was titrated into urea in the absence (black circles) or presence of either LQRRRETQV (triangles) or LQRRRETQ-Abu (squares) peptides. The stability of PDZ1 F95W was increased by peptide binding, with larger stability increases seen at 40 μM peptide (red and blue respectively) compared to 4 μM peptide (pink and cyan respectively). Inset: the relative affinity of the interactions was confirmed by thermophoresis measurements, where the LQRRRETQV peptide bound PDZ1 F95W more tightly (red triangles, Kd ~ 0.9 ± 0.6 μM) than the LQRRRETQ-Abu peptide (blue squares, Kd ~ 13 ± 1 μM).

References

    1. Capelle M.A.H., Gurny R., Arvinte T. High throughput screening of protein formulation stability: practical considerations. Eur. J. Pharm. Biopharm. 2007;65:131–148. - PubMed
    1. Senisterra G.A., Finerty P.J. High throughput methods of assessing protein stability and aggregation. Mol. BioSyst. 2009;5:217–223. - PubMed
    1. Freire E., Schon A., Hutchins B.M., Brown R.K. Chemical denaturation as a tool in the formulation optimization of biologics. Drug Discov. Today. 2013;18:1007–1013. - PMC - PubMed
    1. Martínez J.C., Filimonov V.V., Mateo P.L., Schreiber G., Fersht A.R. A calorimetric study of the thermal stability of barstar and its interaction with barnase. Biochemistry. 1995;34:5224–5233. - PubMed
    1. Fersht A.R., Matouschek A., Serrano L. The folding of an enzyme. J. Mol. Biol. 1992;224:771–782. - PubMed