. 2014 Nov;15(11):1046-54.
doi: 10.1038/ni.3003. Epub 2014 Sep 28.

Chaperone-mediated autophagy regulates T cell responses through targeted degradation of negative regulators of T cell activation

Affiliations

Chaperone-mediated autophagy regulates T cell responses through targeted degradation of negative regulators of T cell activation

Rut Valdor et al. Nat Immunol. 2014 Nov.

Abstract

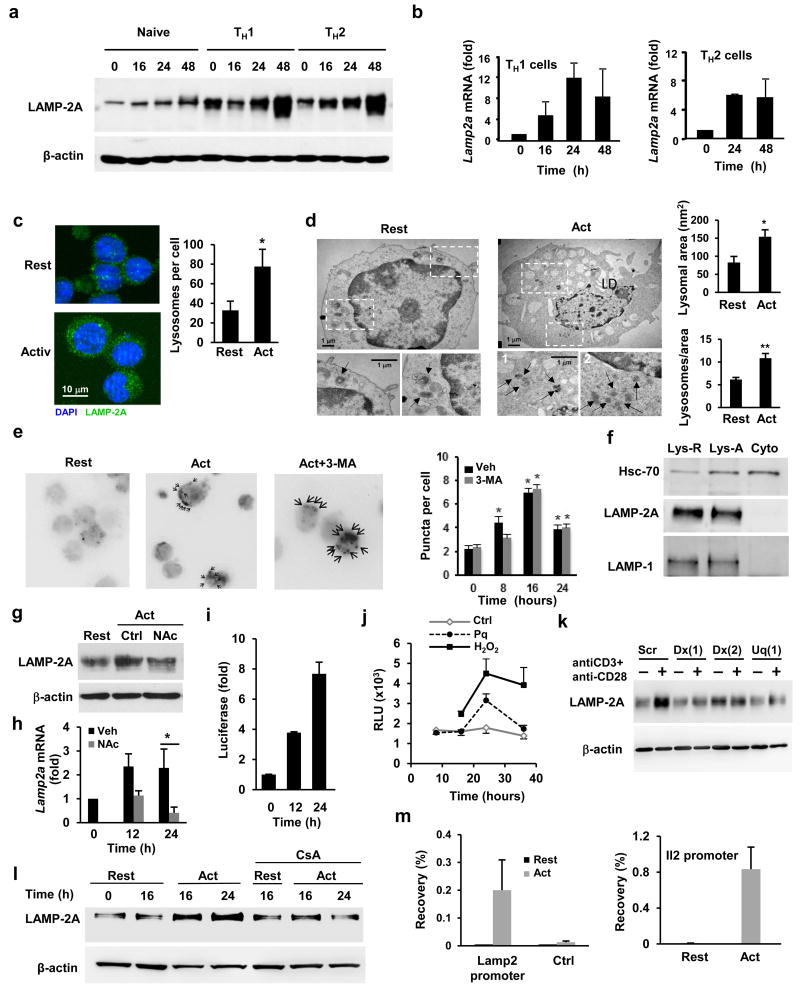
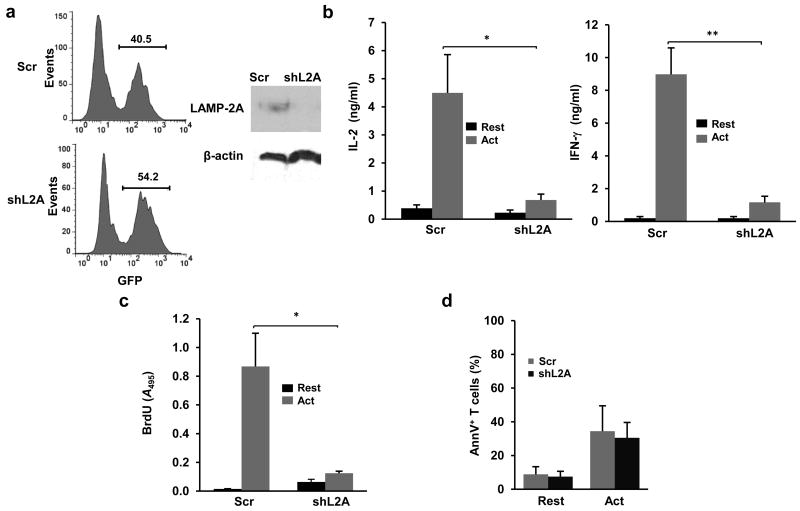
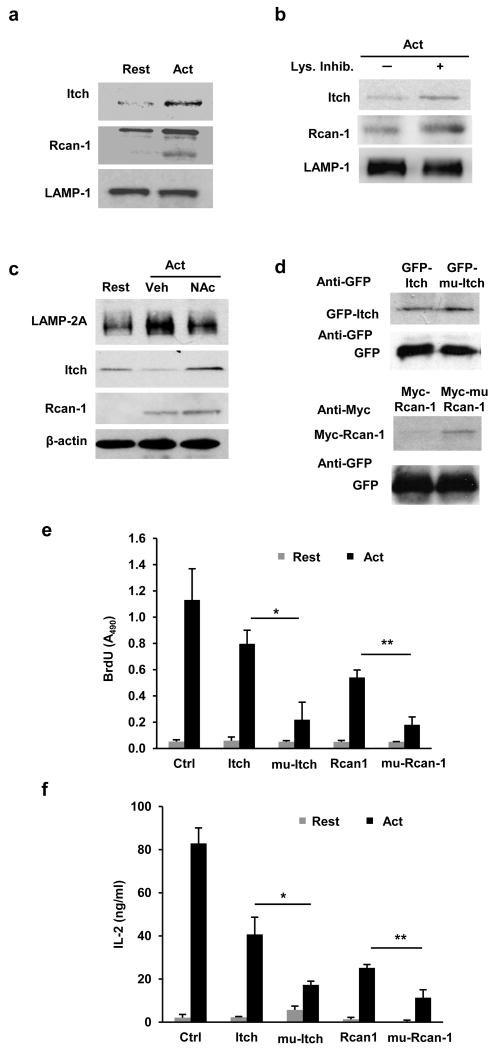
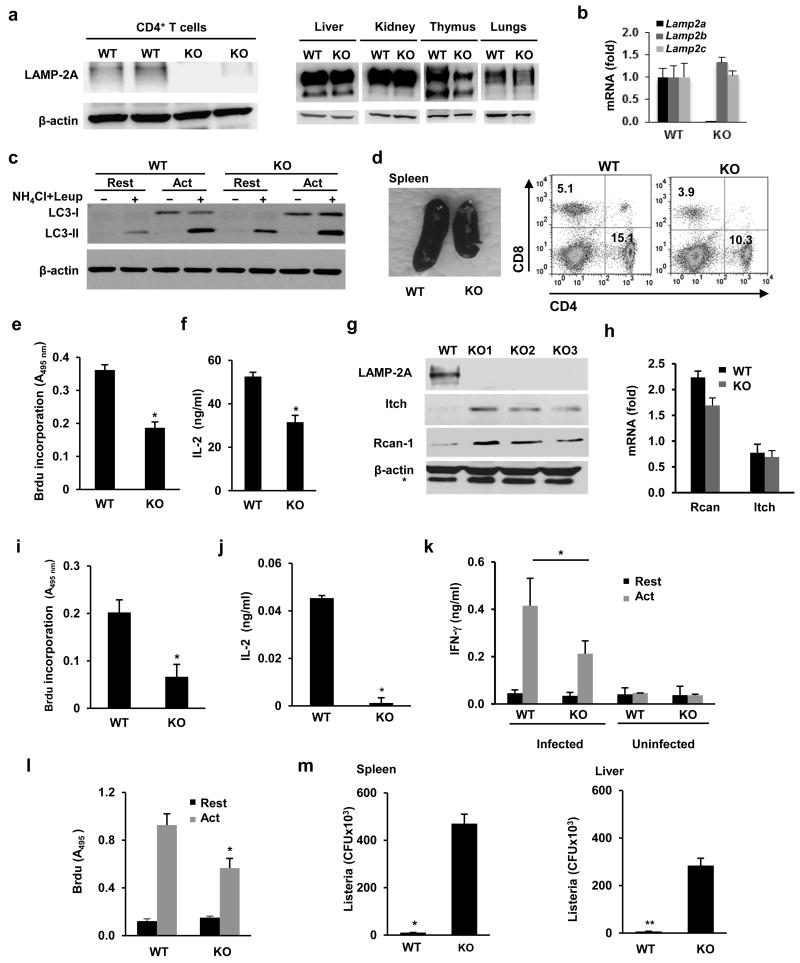
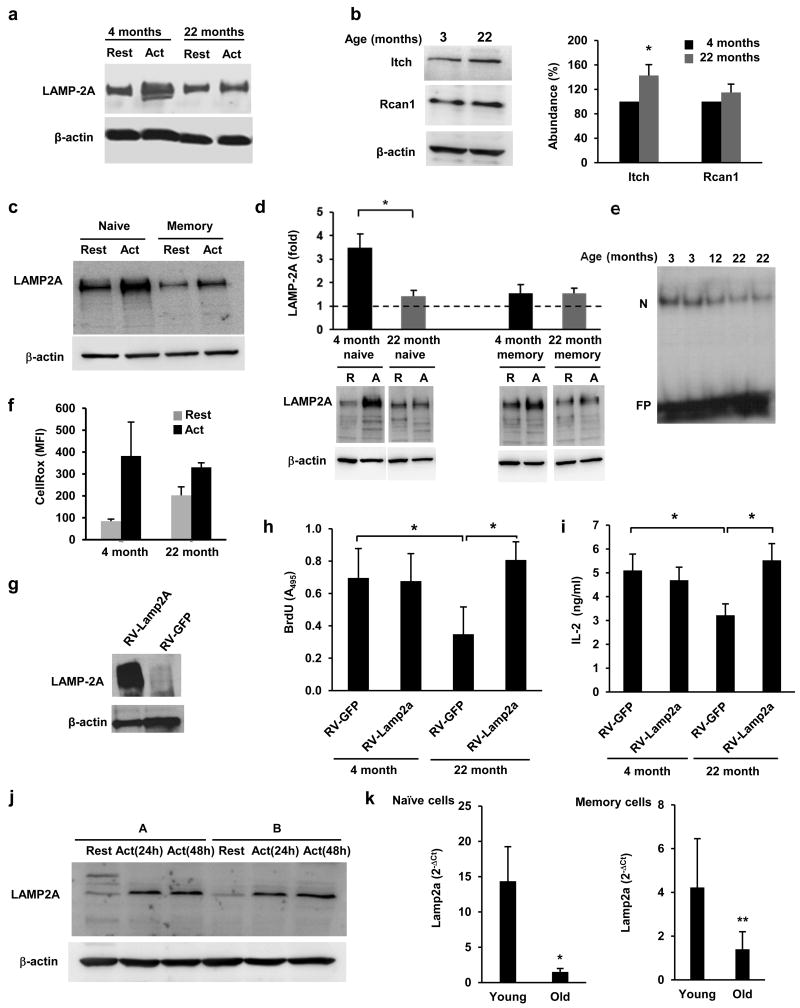
Chaperone-mediated autophagy (CMA) targets soluble proteins for lysosomal degradation. Here we found that CMA was activated in T cells in response to engagement of the T cell antigen receptor (TCR), which induced expression of the CMA-related lysosomal receptor LAMP-2A. In activated T cells, CMA targeted the ubiquitin ligase Itch and the calcineurin inhibitor RCAN1 for degradation to maintain activation-induced responses. Consequently, deletion of the gene encoding LAMP-2A in T cells caused deficient in vivo responses to immunization or infection with Listeria monocytogenes. Impaired CMA activity also occurred in T cells with age, which negatively affected their function. Restoration of LAMP-2A in T cells from old mice resulted in enhancement of activation-induced responses. Our findings define a role for CMA in regulating T cell activation through the targeted degradation of negative regulators of T cell activation.


Figures

Figure 1
Figure 1. TCR engagement activates CMA
(a-b) Immunoblot of LAMP-2A in total cell lysates (representative of 5 experiments) and quantification of Lamp2a gene expression by qPCR (relative to resting cells) in naïve CD4+ T cells and TH1 and TH2 cells following activation with anti-CD3 and anti-CD28 antibodies. (c) LAMP-2A (green) expression determined by immunofluorescence in resting and activated TH1 cells. Nuclei were stained with DAPI (blue). Original magnification 630x. Quantification of number of lysosomes (mean+s.e.m.) performed in 5 fields (20-30cells) from each of three different experiments (n=3; t test; *p=0.013). (d) Electron microscopy images of resting and 24 hours activated TH1 cells. Fields show representative cells and higher-magnification fields show individual lysosomes (black arrows denote lysosomes). Morphometric analysis performed in 8 micrographies (original magnification ×12,000), corresponding to cells from two different experiments. Values are mean+s.e.m.. (n=2; t test; *p =0.037; **p=0.034). (e) KFERQ–PA–mCherry1 distribution in TH1 cells transiently transfected with a CMA reporter vector, photoactivated and stimulated with anti-CD3+anti-CD28 in the presence or absence of 3-Methyladenine (3-MA). Images show representative cells (with arrows indicating mCherry positive puncta; original magnification of 630x). Quantification shown in graph (mean+s.e.m. of 3 different experiments with >50 cells counted per experiment) (n=3; ANOVA with Tukey post-test; *p<0.05). (f) Hsc70 detected by immunoblot in cytosolic (Cyto) and lysosomal fractions from resting (Lys-R) and stimulated (Lys-A) TH1 cells. LAMP-1 and LAMP-2A are used as controls. Blot is representative of 6 different experiments. (g) Immunoblot of LAMP-2A in resting TH1 cells and cells activated in the presence or absence of N-acetylcysteine (NAc) (representative of two different experiments). (h) Lamp2a gene expression quantified by qPCR in TH1 cells and cells activated in the presence or absence of NAc (values, fold increase relative to resting cells, are mean+s.e.m.; n= 4; t test; *p=0.007). (i-j) Relative luciferase activity (to resting cells) in TH1 cells transiently transfected with a vector containing a luciferase reporter under the control of the Lamp2 proximal promoter and stimulated with (i) plate-bound anti-CD3 and anti-CD28 or (j) 50 μM paraquat (Pq) or 1 mM H2O2 for for 16 hours. Results are mean+s.e.m. from (i) 4 or (j) 3 different experiments. (k) Immunoblot showing LAMP-2A protein in total cell lysates (representative blot from 2 similar experiments) of resting and activated (24 hours) TH1 cells transfected with a control non-targeting siRNA (Scr) or siRNAs specific for Duox1 (Dx) or Uqcrfs1 (Uq). (l) Immunoblot showing LAMP-2A in lysates from TH1 cells resting or activated in the presence or absence of cyclosporine A (CsA) (representative of 5 different experiments). (m) Chromatin immunoprecipitation showing NFAT1 recruitment to the Lamp2 gene promoter (% of input precipitated using anti-NFAT1 antibodies) in resting and activated TH1 cells. Binding to Adad1 (Ctrl), is used as negative control, while binding to the Il2 promoter is used as positive control. Graph shows mean+s.e.m. from 4 independent experiments.
Figure 2
Figure 2. Silencing of LAMP-2A expression impairs T cell activation
(a) Immunoblot of LAMP-2A protein in sorted GFP+ T cells transduced with a lentivirus expressing GFP and a specific shRNA for Lamp2a (shL2A) or a non-targeting control shRNA (Scr). (b) IL-2 and INF-γ production measured by ELISA in resting and 24 hours stimulated (anti-CD3+anti-CD28) TH1 cells transduced with a lentivirus expressing shL2A or Scr. Results are mean+s.e.m. from 4 (IL-2) or 5 (IFN-γ) different experiments (t test; *p=0.031; **p=0.038). (c) T cell proliferation measured by BrdU incorporation in resting and 24 hours stimulated TH1 cells transduced with a lentivirus expressing shL2A or Scr. Results are mean+s.e.m. from 4 different experiments (t test *p=0.013). (d) Quantification of Annexin V+ cells (mean+s.e.m.) in resting and stimulated TH1 cells transduced with a lentivirus expressing shL2A or Scr (n=3).
Figure 3
Figure 3. Degradation of Rcan-1 and Itch by CMA in activated T cells
(a) Immunoblot showing enrichment of Itch and Rcan-1 in lysosomal fractions isolated from activated (24 hours antti-CD3+anti-CD28) TH1 cells compared to lysosomes obtained from resting cells. LAMP-1 is used as control. (b) Itch and Rcan-1 detected by immunoblot in lysosomal fractions from TH1 cells activated for 24 hours where lysosomal proteases had been inhibited or not for the last 3 hours with NH4Cl and leupeptin (Lys.Inhib.). LAMP-1 is used as control. (c) Immunoblot showing total cellular Itch and Rcan-1 protein in resting TH1 cells and in cells activated (24 hours) in the presence or absence of N-acetylcysteine (N-Ac). β-actin is used as control. (d) Immunoblot of cell lysates from TH1 cells transfected with plasmids expressing GFP or Myc tagged wild type or KFERQ-mutants (GFP-mu-Itch and Myc-mu-Rcan-1) Itch or Rcan-1, and activated for 24 hours with anti-CD3+anti-CD28. Efficiency of transfection is controlled in all cells with a co-transfected GFP expression plasmid. Blots are representative of 4 (a and b), 2 (c) and 3 (d) different experiments. (e-f) Cell proliferation and IL-2 production measured in TH1 cells transfected with plasmids expressing GFP (Ctrl), wild type Itch, mu-Itch, Rcan-1, mu-Rcan-1 and activated with anti-CD3+anti-CD28 for 24 (IL-2 production) or 48 (proliferation) hours Results are mean+s.e.m. from three different experiments (t test; (e) *p=0.019; **p=0.0034; (f) *p=0.046; **p=0.044).
Figure 4
Figure 4. Reduced T cell responses in CMA-deficient mice
(a) Immunoblot of LAMP-2A in CD4+ T cells, liver, kidneys, thymus and lung of L2A-cKO (KO) mice or wild type littermates (WT). (b) Lamp2a, b and c mRNA expression (mean+s.e.m, expressed as relative to WT values) measured by qPCR in T cells from WT or L2A-cKO mice (n=3). (c) Macroautophagy flux (LC3 flux) measured in resting CD4+ T cells from WT and KO mice or cells activated with anti-CD3 and anti-CD218 for 24 hours (Act). (d) Representative image (from 6 different mice) of spleens from WT and L2A-cKO mice. Distribution of peripheral CD4+ and CD8+ T cells was determined by FACS. (e-f) Cell proliferation and IL-2 production measured in CD4+ T cells isolated from spleens of WT and KO mice following stimulation for 48 hours. Results are mean+s.e.m. of 4 (e) 6 (f) independent experiments (t test, (e) *p=0.0062; (f) *p=0.006). g. Immunoblot of Itch and Rcan-1 proteins in total lysates from activated (24 hours) CD4+ T cells of 3 different KO mice compared to WT littlermate controls. * Non-specific band. (h) Expression of Lamp2a mRNA assessed by qPCR in samples obtained from resting or activated for 24 hours CD4+ T cells isolated form WT or KO mice Data (mean+s.e.m. from 3 different experiments) is presented as fold induction of mRNA expression following activation. (i-j) Recall responses to OVA323-339 peptide (cell proliferation and IL-2 production) in draining lymph nodes isolated from OVA323-339-immunized KO mice and WT littermates. Results are mean+s.e.m. from 4 different experiments (t test; (i) *p=0.0054; (j) *p=0.0052). (k-l) Recall responses (cell proliferation and cytokine production) to Listeria in CD4+ T cells isolated from naïve or previously infected WT or KO mice. Graphs show mean+s.e.m. from 6 mice analyzed in two independent experiments (t test; (k) *p=0.032; (l) *p=0.02). (m) Listeria CFU in spleen and liver measured in previously immunized WT and KO mice after reinfection with a high dose of Listeria. Results show mean+s.e.m. from data obtained in triplicate from three different mice (t test; *p=0.008; **p=0.001).
Figure 5
Figure 5. Deficient regulation of LAMP-2A expression in aged T cells
(a) LAMP-2A protein detected by immunoblot in CD4+ T cells from 4-month and 22-month old mice that were left resting or stimulated with anti-CD3+anti-CD28 for 24 hours. Image representative of 3 different experiments. (b) Immunoblot showing Rcan-1 and Itch in CD4+ T cells from 4 and 22 month old mice stimulated for 24 hours. A quantification of blots from 3 different mice is shown (% of the protein content in 4 month old mice. mean+s.e.m.; t test; *p=0.044). (c-d) Immunoblot of LAMP-2A in total cell lysates prepared form resting and activated (24 hours) naive and memory CD4+ T cells (c). Similar experiments using naïve and memory CD4+ T cells from 4 month and 22 month old mice (d). A representative immunoblot and the quantification from blots of 3 different young and 3 old mice are shown (mean+s.e.m.; t test; *p=0.009). (e) EMSA showing NFAT binding using nuclear extracts from CD4+ T cells isolated from 3, 12 or 22 month old mice and activated for 4 hours. (N:NFAT; FP: free probe) (f) ROS production measured by FACS using CellRox-green in CD4+ T cells isolated from 4 or 22 month old mice and activated for 12 hours. Data (mean+s.e.m. from 3 different mice) is presented as mean fluorescence intensity (MFI). (g-i) Immunoblot for LAMP-2A (g), proliferation (h) and IL-2 production (i) measured in TH1 cells from 4 or 22 month old mice transduced with a retrovirus expressing human LAMP-2A and GFP (RV-Lamp2a) or just GFP (RV-GFP). Infected cells were sorted by GFP expression, cultured for 2 weeks and then stimulated for 24 to 48 hours. Results are mean+s.e.m. from 4 (h) and 5 (i) different experiments (ANOVA with Tukey post-test; *p<0.05). (j) Immunoblot showing LAMP-2A in total cell lysates obtained from resting and activated CD4+ T cells from two human donors (A and B). (k) Lamp2a mRNA expression measured by real time PCR in naïve and memory CD4+ T cells obtained from 3 young (26±2 years old) and 6 old (72±6 years old) human donors and activated for 24 hours. 2−ΔCt values (mean+s.e.m.) were calculated using actin as a reference gene (Mann-Whitney; *p=0.0033; **p=0.047).

References

    1. Mizushima N, Levine B. Autophagy in mammalian development and differentiation. Nat Cell Biol. 2010;12:823–830. - PMC - PubMed
    1. Cuervo AM, Macian F. Autophagy, nutrition and immunology. Mol Aspects Med. 2012;33:2–13. - PMC - PubMed
    1. Dice JF. Peptide sequences that target cytosolic proteins for lysosomal proteolysis. Trends Biochem Sci. 1990;15:305–309. - PubMed
    1. Chiang HL, Terlecky SR, Plant CP, Dice JF. A role for a 70-kilodalton heat shock protein in lysosomal degradation of intracellular proteins. Science. 1989;246:382–385. - PubMed
    1. Cuervo AM, Dice JF. Unique properties of lamp2a compared to other lamp2 isoforms. J Cell Sci. 2000;113 Pt 24:4441–4450. - PubMed

Publication types

MeSH terms