

Relating tissue/organ energy expenditure to metabolic fluxes in mouse and human: experimental data integrated with mathematical modeling
- PMID: 25263208
- PMCID: PMC4270223
- DOI: 10.14814/phy2.12159
Relating tissue/organ energy expenditure to metabolic fluxes in mouse and human: experimental data integrated with mathematical modeling
Abstract
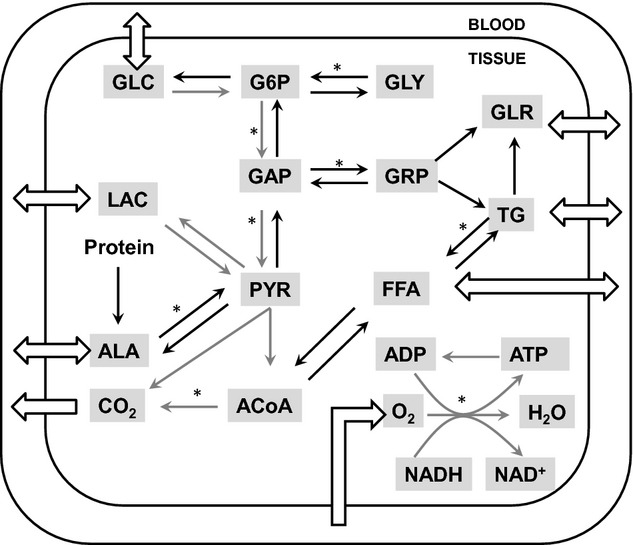
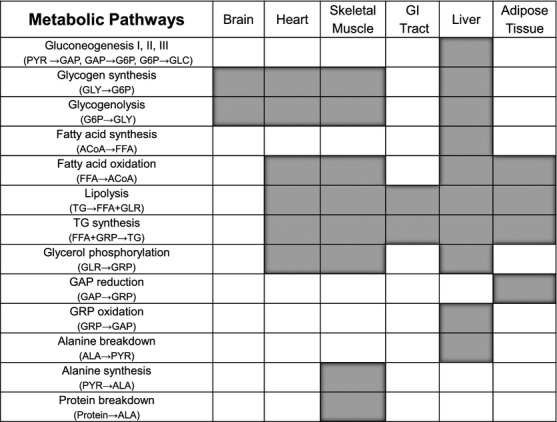
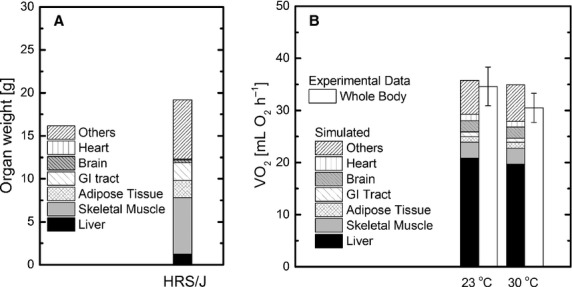
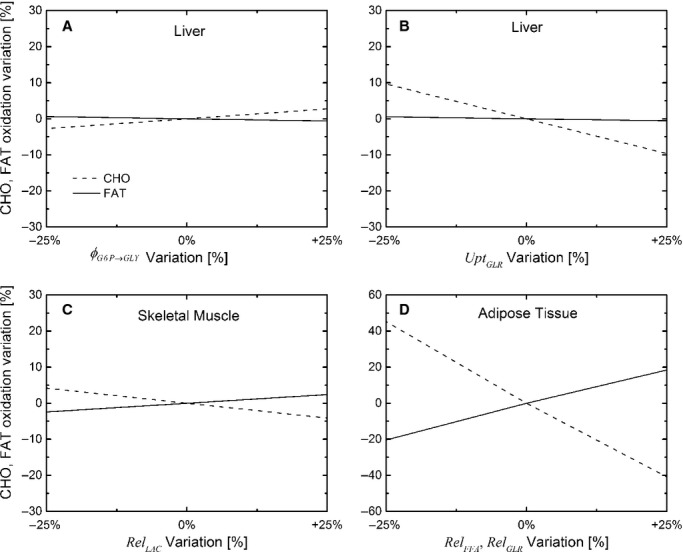
Mouse models of human diseases are used to study the metabolic and physiological processes leading to altered whole-body energy expenditure (EE), which is the sum of EE of all body organs and tissues. Isotopic techniques, arterio-venous difference of substrates, oxygen, and blood flow measurements can provide essential information to quantify tissue/organ EE and substrate oxidation. To complement and integrate experimental data, quantitative mathematical model analyses have been applied in the design of experiments and evaluation of metabolic fluxes. In this study, a method is presented to quantify the energy expenditure of the main mouse organs using metabolic flux measurements. The metabolic fluxes and substrate utilization of the main metabolic pathways of energy metabolism in the mouse tissue/organ systems and the whole body are quantified using a mathematical model based on mass and energy balances. The model is composed of six organ/tissue compartments: brain, heart, liver, gastrointestinal tract, muscle, and adipose tissue. Each tissue/organ is described with a distinct system of metabolic reactions. This model quantifies metabolic and energetic characteristics of mice under overnight fasting conditions. The steady-state mass balances of metabolites and energy balances of carbohydrate and fat are integrated with available experimental data to calculate metabolic fluxes, substrate utilization, and oxygen consumption in each tissue/organ. The model serves as a paradigm for designing experiments with the minimal reliable measurements necessary to quantify tissue/organs fluxes and to quantify the contributions of tissue/organ EE to whole-body EE that cannot be easily determined currently.
Keywords: Energy metabolism; flux balance analysis; metabolic pathway fluxes; oxygen consumption; substrate utilization.
© 2014 The Authors. Physiological Reports published by Wiley Periodicals, Inc. on behalf of the American Physiological Society and The Physiological Society.
Figures

References
-
- Andrikopoulos S., Proietto J. 1995. The biochemical basis of increased hepatic glucose production in a mouse model of type 2 (non‐insulin‐dependent) diabetes mellitus. Diabetologia; 38:1389-1396. - PubMed
-
- Bergman B. C., Jensen D. R., Pulawa L. K., Ferreira L. D., Eckel R. H. 2006. Fasting decreases free fatty acid turnover in mice overexpressing skeletal muscle lipoprotein lipase. Metabolism; 55:1481-1487. - PubMed
-
- Blaxter K. L. Energy metabolism in animals and man. Cambridge, U.K: Cambridge Univ. Press; 1989. p. 336.
-
- Chacko S. K., Haymond M. W., Sun Y., Marini J. C., Sauer P. J., Ma X. 2012. Effect of ghrelin on glucose regulation in mice. Am J Physiol Endocrinol Metab; 302:E1055-E1062. - PubMed
Grants and funding
LinkOut - more resources
Full Text Sources
Other Literature Sources
