. 2014 Oct 9;159(2):440-55.
doi: 10.1016/j.cell.2014.09.014. Epub 2014 Sep 25.

CRISPR-Cas9 knockin mice for genome editing and cancer modeling

Affiliations

CRISPR-Cas9 knockin mice for genome editing and cancer modeling

Randall J Platt et al. Cell. .

Abstract

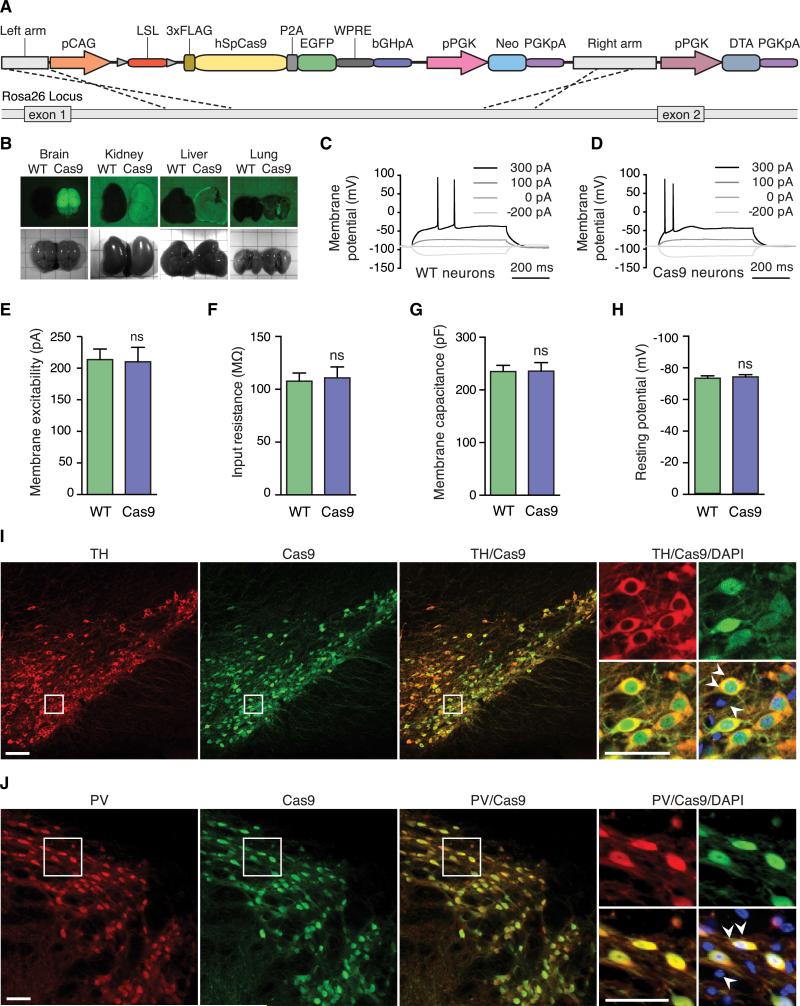
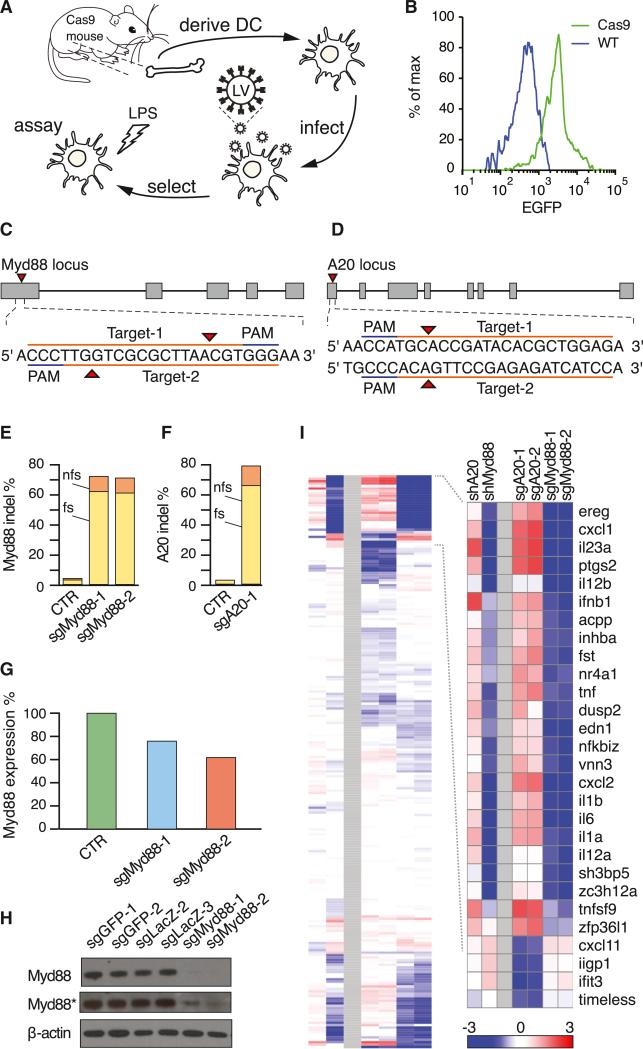
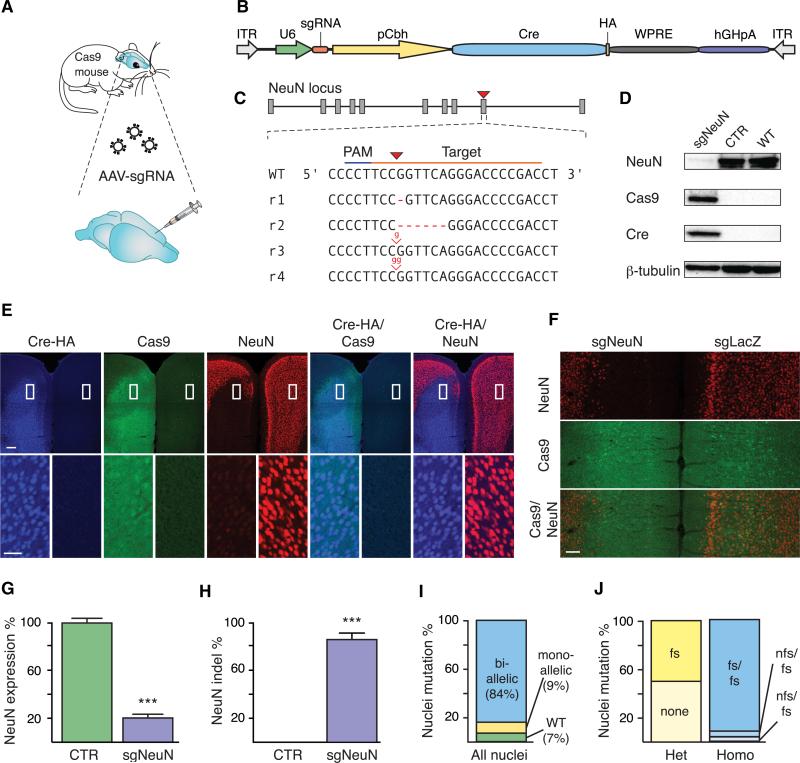
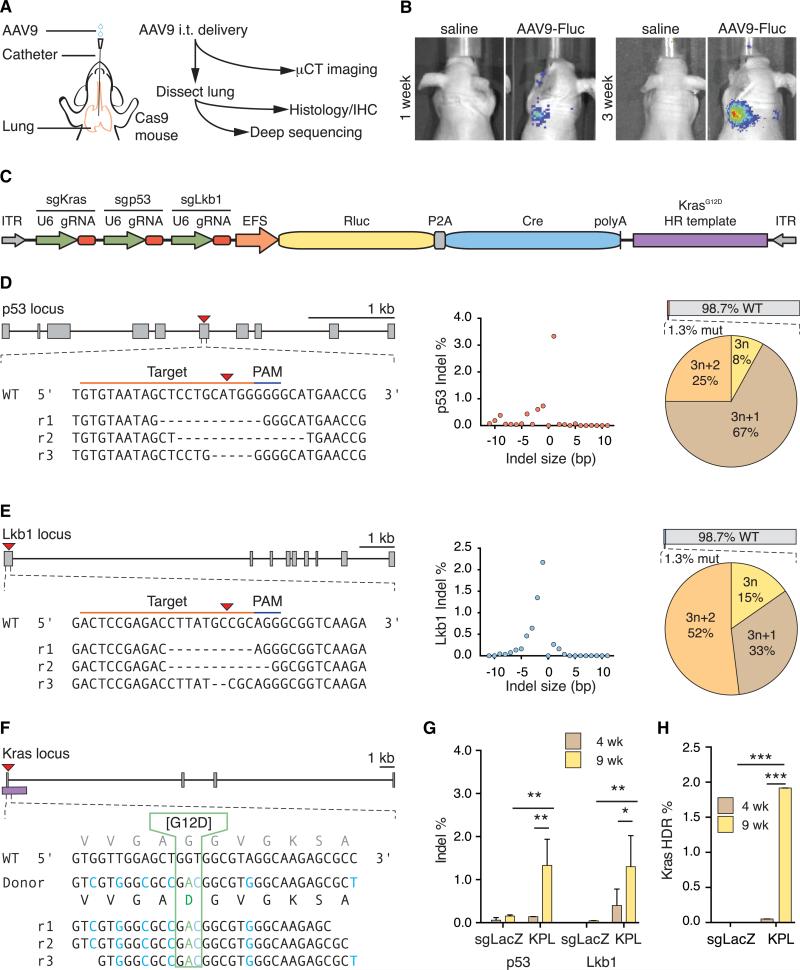
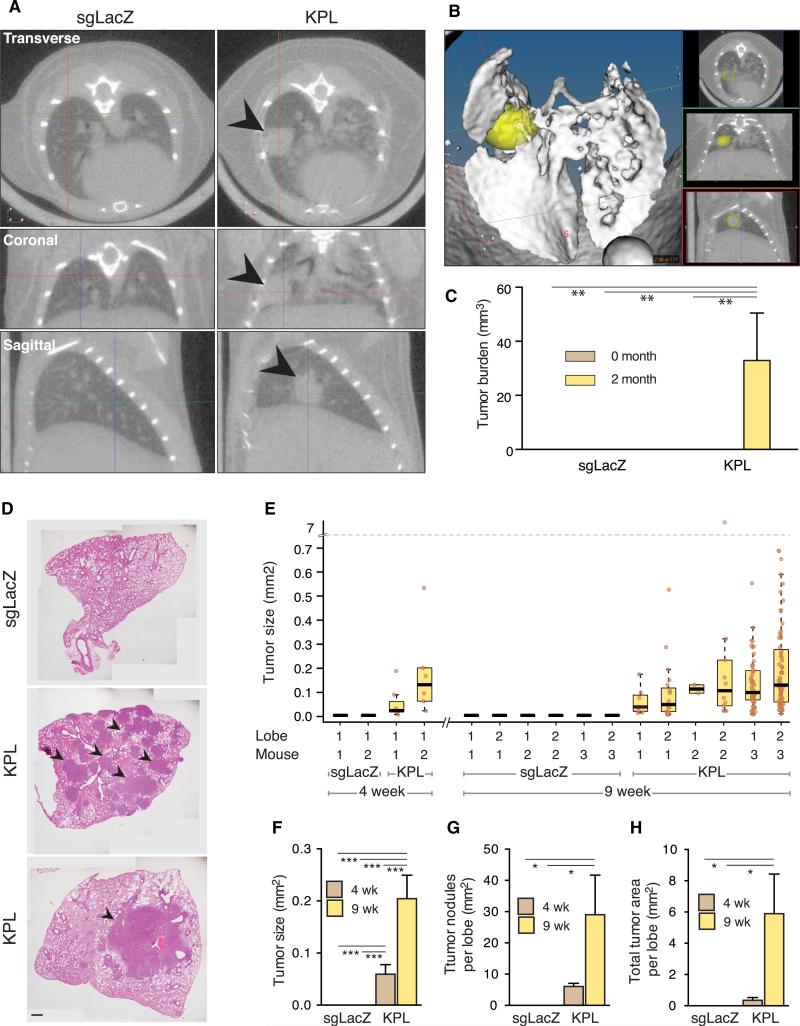
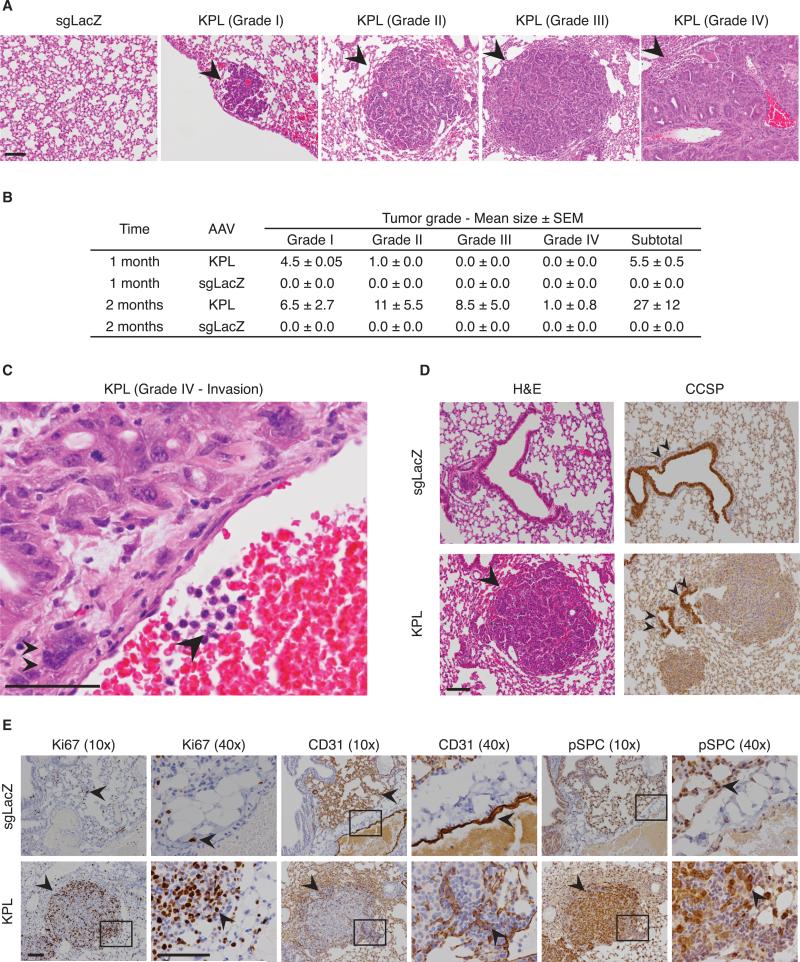
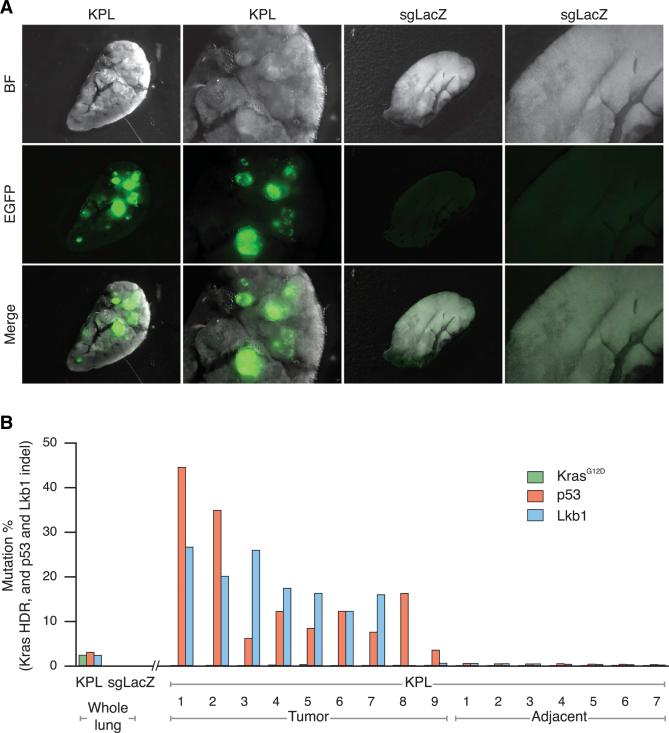
CRISPR-Cas9 is a versatile genome editing technology for studying the functions of genetic elements. To broadly enable the application of Cas9 in vivo, we established a Cre-dependent Cas9 knockin mouse. We demonstrated in vivo as well as ex vivo genome editing using adeno-associated virus (AAV)-, lentivirus-, or particle-mediated delivery of guide RNA in neurons, immune cells, and endothelial cells. Using these mice, we simultaneously modeled the dynamics of KRAS, p53, and LKB1, the top three significantly mutated genes in lung adenocarcinoma. Delivery of a single AAV vector in the lung generated loss-of-function mutations in p53 and Lkb1, as well as homology-directed repair-mediated Kras(G12D) mutations, leading to macroscopic tumors of adenocarcinoma pathology. Together, these results suggest that Cas9 mice empower a wide range of biological and disease modeling applications.


Figures

Figure 1
Figure 1. Generation and Characterization of Cre-Dependent and Constitutive Cas9-Expressing Mice
(A) Schematic of the Cre-dependent Cas9 Rosa26 targeting vector. (B) Bright-field and fluorescence stereomicroscope images of tissues dissected from constitutive Cas9-expressing (left) and wild-type (right) mice, showing Cas9-P2A-EGFP expression only in Cas9 mice. (C and D) Representative current-clamp recordings and evoked action potentials from wild-type (C) and constitutive Cas9-expressing (D) neurons, showing no difference. (E–H) Electrophysiological characterization of hippocampal neurons in acute slices from constitutive Cas9-expressing and wild-type neurons, showing no significant difference in: membrane excitability (E), input resistance (F), membrane capacitance (G), and resting potential (H). Data are plotted as mean ± SEM; n = 12 neurons from two wild-type mice and n = 15 neurons from two constitutive Cas9-expressing mice. n.s., not significant. See also Table S1. (I) Representative immunofluorescence images of the substantia nigra in progenies from a Cre-dependent Cas9 mouse crossed with a TH-IRES-Cre driver mouse, showing Cas9 expression is restricted to TH-positive cells. Double arrowheads indicate a cell coexpressing TH and Cas9-P2A-EGFP. Single arrowhead indicates a cell expressing neither TH nor Cas9-P2A-EGFP. Scale bar, 100 μm. (J) Representative immunofluorescence images of the reticular thalamus in progenies from a Cre-dependent Cas9 mouse crossed with a PV-Cre driver mouse, showing that Cas9 expression is restricted to PV-positive cells. Double arrowheads indicate a cell expressing PV and Cas9-P2A-EGFP. Single arrowhead indicates a cell expressing neither PV nor Cas9-P2A-EGFP. Scale bar, 50 μm. See also Figure S1 and Table S1.
Figure 2
Figure 2. Ex Vivo Genome Editing of Primary Immune Cells Derived from Constitutive Cas9-Expressing Mice
(A) Schematic of ex vivo genome editing experimental flow. (B) Flow cytometry histogram of bone marrow cells from constitutive Cas9-expressing (green) and wild-type (blue) mice, showing Cas9-P2A-EGFP expression only in Cas9 mice. Data are plotted as a percentage of the total number of cells. (C) sgRNA design for targeting the mouse Myd88 locus. (D) sgRNA design for targeting the mouse A20 locus. (E) Myd88 indel analysis of constitutive Cas9-expressing DCs transduced with either a Myd88-targeting sgRNA (sgMyd88-1 and sgMyd88-2) or controls (CTR, average of four control sgRNAs), showing indel formation only in Myd88-targeted cells. Data are plotted as the percent of Illumina sequencing reads containing indels at the target site. Mutations are categorized as frameshift (fs, yellow bar) or non-frameshift (nfs, orange bar). (F) A20 indel analysis of constitutive Cas9-expressing DCs transduced with either an A20-targeting sgRNA (sgA20-1) or controls (CTR, average of four control sgRNAs), showing indel formation only in A20-targeted cells. Data are plotted as the percent of Illumina sequencing reads containing indels at the target site. Mutations are categorized as frameshift (fs, yellow bar) or non-frameshift (nfs, orange bar). (G) Myd88 mRNA quantification of constitutive Cas9-expressing DCs transduced with either Myd88-targeting sgRNA (sgMyd88-1 or sgMyd88-2) or controls (CTR, average of six control sgRNAs), showing reduced expression only in Myd88-targeted cells. Data are plotted as Myd88 mRNA levels from Nanostring nCounter analysis. (H) Immunoblot of constitutive Cas9-expressing DCs transduced with either Myd88-targeting sgRNA (sgMyd88-1 or sgMyd88-2) or controls (four control sgRNAs), showing depletion of Myd88 protein only in Myd88-targeted cells. β-actin was used as a loading control. (Asterisk) Overexposed, repeated-measurement. (I) Nanostring nCounter analysis of constitutive Cas9-expressing DCs transduced with either Myd88-targeting sgRNA (sgMyd88-1 or sgMyd88-2) or shRNA (shMyd88), A20-targeting sgRNA (sgA20-1 or sgA20-2), or shRNA (shA20), showing an altered LPS response. (Inset) The cluster showing the highest difference between Myd88- and A20-targeting sgRNAs, including key inflammatory genes (IL1a, IL1b, Cxcl1, Tnf, etc.). (Red) High; (blue) low; (white) unchanged; based on fold change relative to measurements with six control sgRNAs. See also Figure S2.
Figure 3
Figure 3. In Vivo Genome Editing in the Brain of Cre-Dependent Cas9 Mice
(A) Schematic showing experimental procedure for stereotactic delivery of sgNeuN-expressing AAV into the prefrontal cortex of Cre-dependent Cas9 mice. (B) Schematic of AAV vector for sgRNA expression. (C) sgRNA design for targeting the mouse NeuN locus and representative Illumina sequencing reads (rn) from Cre-dependent Cas9 mice injected with AAV1/2-NeuN, showing indel formation at the target site (red arrow). (D) Representative immunoblot of brain tissue dissected from Cre-dependent Cas9 mice injected with either AAV1/2-sgNeuN or AAV1/2-sgLacZ or not injected, showing NeuN depletion only in NeuN-targeted mice. β-tubulin was used as a loading control. (E) Representative immunofluorescence images of the prefrontal cortex of Cre-dependent Cas9 mice injected with AAV1/2-sgNeuN 3 weeks posttransduction, showing Cre-mediated activation of Cas9-P2A-EGFP and corresponding NeuN depletion (NeuN). Bottom row shows magnified view of the boxed regions. Scale bars, 200 μm (top) and 50 μm (bottom). (F) Representative immunofluorescence images of the prefrontal cortex of Cre-dependent Cas9 mice injected bilaterally with AAV1/2-sgNeuN (left hemisphere) or AAV1/2-sgLacZ (right hemisphere) 3 weeks posttransduction, showing NeuN depletion only in the NeuN-targeted hemisphere. Scale bar, 200 μm. (G) Quantification of immunoblots of brain tissues dissected from Cre-dependent Cas9 mice injected with either AAV1/2-sgNeuN or AAV1/2-sgLacZ 3 weeks posttransduction, showing significant NeuN depletion only in NeuN-targeted mice. Data are plotted as mean ± SEM (n = 3 mice). ***p < 0.0005. (H) NeuN indel analysis of populations of neuronal nuclei from Cre-dependent Cas9 mice injected with an AAV1/2-EGFP-KASH vector expressing either sgNeuN or sgLacZ 3 weeks posttransduction, showing significant indel formation only in NeuN-targeted cells. Data are plotted as the mean ± SEM (n = 3 mice). ***p < 0.0005. (I) NeuN indel analysis of single neuronal nuclei from Cre-dependent Cas9 mice injected with an AAV1/2-EGFP-KASH vector expressing sgNeuN, showing that 84% of transduced neurons are mutated on both alleles. Individual nuclei are categorized as bi-allelic, mono-allelic, or wild-type. Data are plotted as a percent of nuclei (n = 167). (J) NeuN indel analysis of single neuronal nuclei from Cre-dependent Cas9 mice injected with an AAV1/2-EGFP-KASH vector expressing sgNeuN, showing that most mutations are frameshift. Individual allele mutations from homozygous (n = 141) or heterozygous (n = 15) nuclei are categorized as either frameshift (fs) or non-frameshift (nfs). Data are plotted as a percent of homozygous (n = 141) or heterozygous (n = 15) nuclei.
Figure 4
Figure 4. In Vivo AAV9-KPL Delivery and Mutation Analysis
(A) Schematic of intratracheal (i.t.) delivery of AAV9 into the lung of a Cre-dependent Cas9 mouse and experimental flow. (B) Luciferase imaging of nude mice injected with either AAV9-Fluc or saline, showing efficient AAV9-mediated expression in vivo in the lung. (C) Schematic of the AAV-KPL vector. (D and E) (Left) sgRNA designs for targeting the mouse p53 (D) and LKB1 (E) loci and representative Illumina sequencing reads (rn) from Cre-dependent Cas9 mice injected with AAV9-KPL, showing indel formation at the target site. (Middle) Size distribution of indels found at the target site. (Right) Indel analysis from whole lung (top) and the phase characteristics of edited alleles (bottom). p53 and LKB1 loci scale bars, 1 kb. (F) sgRNA and HDR donor design for targeting the mouse KRAS locus for G12D incorporation and representative Illumina sequencing reads (rn) from Cre-dependent Cas9 mice injected with AAV9-KPL. Green text indicates the G12D mutation, whereas blue text indicates the intended synonymous mutations, showing successful generation of the KRASG12D mutation. KRAS locus scale bar, 1 kb. (G) p53 and LKB1 indel analysis of whole lung from Cre-dependent Cas9 mice injected with either AAV9-KPL or AAV9-sgLacZ, showing significant indel formation only in AAV9-KPL-injected mice. Data are plotted as mean ± SEM. *p < 0.05; **p < 0.005. (H) KRASG12D mutation analysis of whole lung from Cre-dependent Cas9 mice injected with either AAV9-KPL or AAV9-sgLacZ, showing significant G12D incorporation only in AAV9-KPL-injected mice. The data are plotted as the mean ± SEM. ***p < 0.0005. See also Figures S3, S4, and S5.
Figure 5
Figure 5. In Vivo Tumor Formation in AAV9-KPL-Injected Mice
(A) Lung mCT images of Cre-dependent Cas9 mice injected with either AAV9-KPL or AAV9-sgLacZ 2 months posttransduction, showing tumor formation (indicated by the arrowhead) only in AAV9-KPL injected mice. (B) Lung μCT 3D rendering of Cre-dependent Cas9 mice injected with AAV9-KPL 2 months posttransduction, showing tumor formation (indicated by a yellow oval). (C) Major tumor burden quantification of Cre-dependent Cas9 mice injected with either AAV9-KPL or AAV9-sgLacZ, showing significant tumor burden in AAV9-KPL-injected mice. Data are plotted as mean ± SEM. **p < 0.005. (D) Representative lung H&E images of Cre-dependent Cas9 mice injected with either AAV9-KPL or AAV9-sgLacZ 9 weeks posttransduction, showing heterogeneous tumor formation in AAV9-KPL-injected mice. Arrowheads highlight a representative subset of tumors within the lungs of AAV9-KPL injected mice. Scale bar, 500 μm. (E) Lung tumor size quantification of Cre-dependent Cas9 mice injected with either AAV9-KPL or AAV9-sgLacZ 9 weeks posttransduction. Data are plotted as a boxplot, with each box representing the group's median, upper, and lower quantiles, and 95% confidence interval. Data points of individual tumors were overlaid as brown dots. (F–H) Average tumor size (F), average nodules per lobe (G), and total tumor area per lobe (H) quantification of Cre-dependent Cas9 mice injected with either AAV9-KPL or AAV9-sgLacZ 9 weeks posttransduction, showing the range of tumor heterogeneity in AAV9-KPL injected mice. Data are plotted as mean ± SEM. *p < 0.05, **p < 0.005, ***p < 0.0005. See also Figures S3, S4, and S5.
Figure 6
Figure 6. Histopathology of Tumors Formed within AAV9-KPL-Injected Mice
(A) Representative lung H&E images of Cre-dependent Cas9 mice injected with either AAV9-KPL or AAV9-sgLacZ 9 weeks posttransduction, showing a spectrum of grade I to grade IV tumors. Black arrowheads highlight tumors. Scale bar, 100 μm. (B) Table of tumor grade statistics. (C) Representative lung H&E and IHC images of Cre-dependent Cas9 mice injected with AAV9-KPL 9 weeks posttransduction, showing grade IV adenocarcinoma with signs of invasion (arrowhead) and aneuploidy (double arrowheads). Scale bar, 100 μm. (D) Representative lung H&E and IHC images of Cre-dependent Cas9 mice injected with either AAV9-KPL or AAV9-sgLacZ 9 weeks posttransduction. H&E images show tumor formation only in AAV9-KPL-injected mice. Clara cell secretory protein (CCSP), a marker for Clara cells, staining shows a tumor adjacent to these cells (double arrowheads). Scale bar, 100 μm. (E) Representative IHC images of Cre-dependent Cas9 mice injected with either AAV9-KPL or AAV9-sgLacZ 9 weeks posttransduction. Ki67, a marker for proliferating cells (arrow), staining showing extensive proliferation in tumors found within AAV9-KPL injected Cre-dependent Cas9 mice. CD31, a marker for endothelial cells (arrow), staining showing embedded CD31-positive endothelial cells. Positive for prosurfactant C (pSPC), a marker for type II pneumocytes, staining suggests tumors originate from this cell type. Scale bar, 200 μm. See also Figures S3, S4, and S5 and Table S2.
Figure 7
Figure 7. Mutational Analysis of Individual Tumors
(A) Representative stereomicroscope lung images of Cre-dependent Cas9 mice injected with either AAV9-KPL or AAV9-sgLacZ 9 weeks post-transduction, showing EGFP-positive tumors only within the lung of an AAV9-KPL injected mouse. (B) KRAS, p53, and LKB1 mutational analysis of whole lung and individual tumors dissected from Cre-dependent Cas9 mice injected with either AAV9-KPL or AAV9-sgLacZ 9 weeks post-transduction, showing p53 and LKB1 mutations predominate in fast-growing tumors. The data are plotted as the percent of Illumina sequencing reads containing KRASG12D HDR, p53 indels, or LKB1 indels at the target site in whole lung, dissected tumors, or adjacent tissues.

References

    1. Amit I, Garber M, Chevrier N, Leite AP, Donner Y, Eisenhaure T, Guttman M, Grenier JK, Li W, Zuk O, et al. Unbiased reconstruction of a mammalian transcriptional network mediating pathogen responses. Science. 2009;326:257–263. - PMC - PubMed
    1. Barrangou R, Fremaux C, Deveau H, Richards M, Boyaval P, Moineau S, Romero DA, Horvath P. CRISPR provides acquired resistance against viruses in prokaryotes. Science. 2007;315:1709–1712. - PubMed
    1. Bell CL, Vandenberghe LH, Bell P, Limberis MP, Gao GP, Van Vliet K, Agbandje-McKenna M, Wilson JM. The AAV9 receptor and its modification to improve in vivo lung gene transfer in mice. J. Clin. Invest. 2011;121:2427–2435. - PMC - PubMed
    1. Beronja S, Janki P, Heller E, Lien WH, Keyes BE, Oshimori N, Fuchs E. RNAi screens in mice identify physiological regulators of oncogenic growth. Nature. 2013;501:185–190. - PMC - PubMed
    1. Bibikova M, Carroll D, Segal DJ, Trautman JK, Smith J, Kim YG, Chandrasegaran S. Stimulation of homologous recombination through targeted cleavage by chimeric nucleases. Mol. Cell. Biol. 2001;21:289–297. - PMC - PubMed

Publication types

Associated data