. 2015 Jul;34(29):3760-9.
doi: 10.1038/onc.2014.292. Epub 2014 Sep 29.

Anticipatory estrogen activation of the unfolded protein response is linked to cell proliferation and poor survival in estrogen receptor α-positive breast cancer

Affiliations

Anticipatory estrogen activation of the unfolded protein response is linked to cell proliferation and poor survival in estrogen receptor α-positive breast cancer

N Andruska et al. Oncogene. 2015 Jul.

Abstract

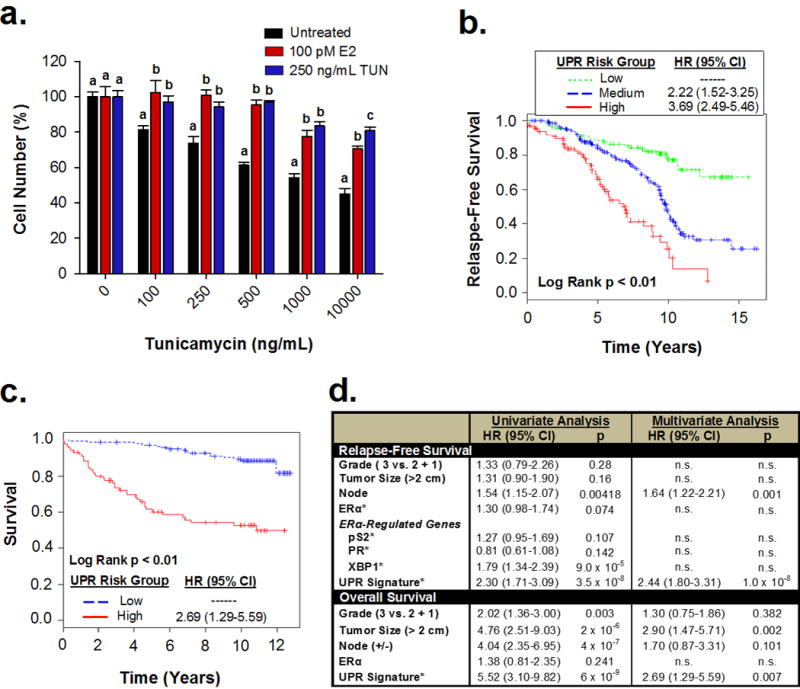
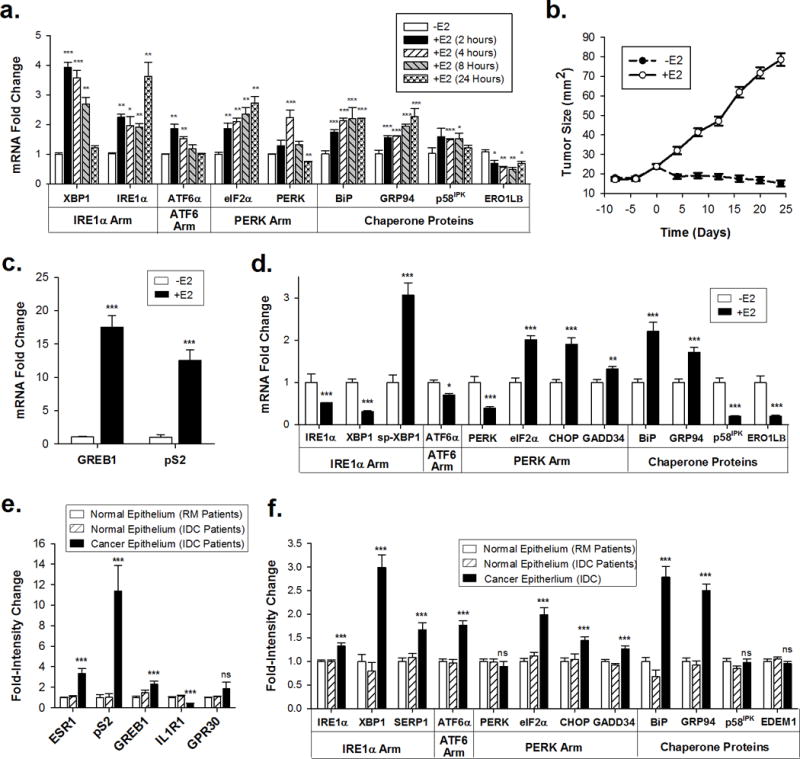
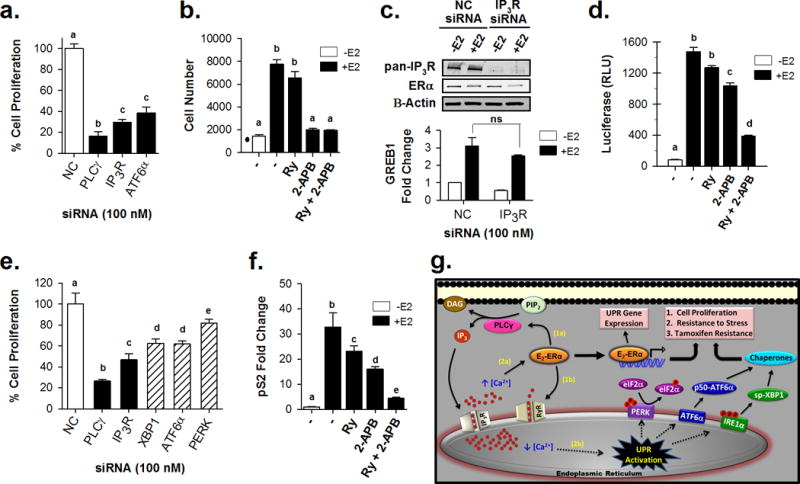
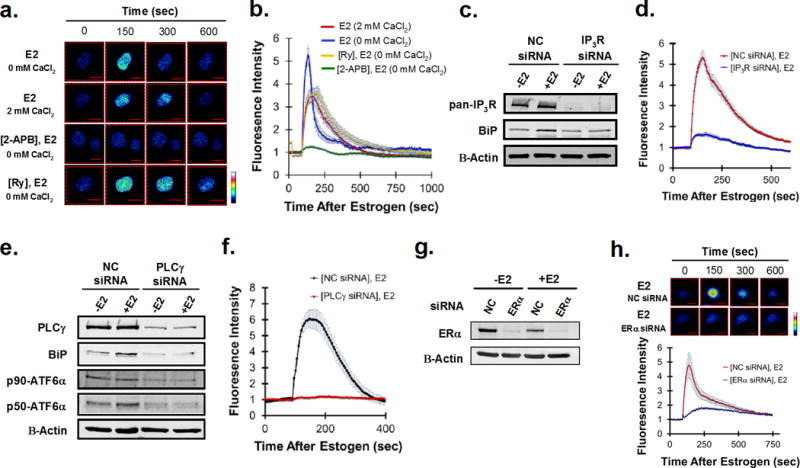
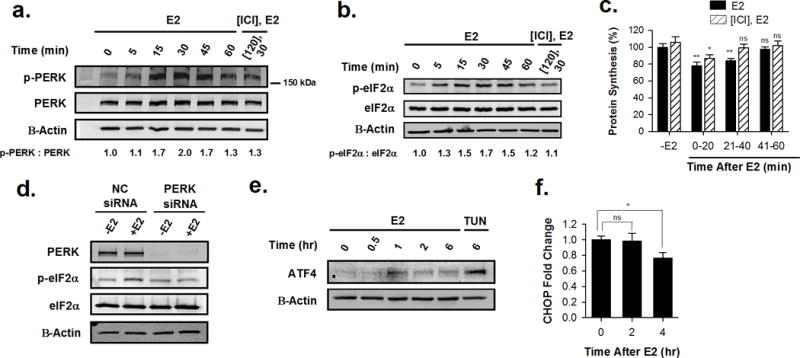
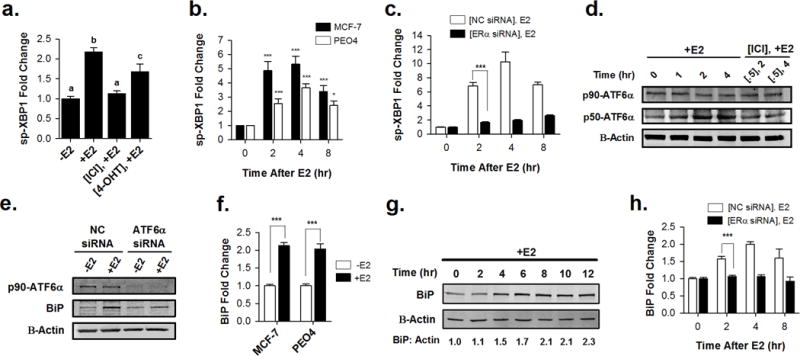
In response to cell stress, cancer cells often activate the endoplasmic reticulum (EnR) stress sensor, the unfolded protein response (UPR). Little was known about the potential role in cancer of a different mode of UPR activation, anticipatory activation of the UPR prior to accumulation of unfolded protein or cell stress. We show that estrogen, acting via estrogen receptor α (ERα), induces rapid anticipatory activation of the UPR, resulting in increased production of the antiapoptotic chaperone BiP/GRP78, preparing cancer cells for the increased protein production required for subsequent estrogen-ERα-induced cell proliferation. In ERα-containing cancer cells, the estrogen, 17β-estradiol (E2) activates the UPR through a phospholipase C γ (PLCγ)-mediated opening of EnR IP3R calcium channels, enabling passage of calcium from the lumen of the EnR into the cytosol. siRNA knockdown of ERα blocked the estrogen-mediated increase in cytosol calcium and UPR activation. Knockdown or inhibition of PLCγ, or of IP3R, strongly inhibited the estrogen-mediated increases in cytosol calcium, UPR activation and cell proliferation. E2-ERα activates all three arms of the UPR in breast and ovarian cancer cells in culture and in a mouse xenograft. Knockdown of ATF6α, which regulates UPR chaperones, blocked estrogen induction of BiP and strongly inhibited E2-ERα-stimulated cell proliferation. Mild and transient UPR activation by estrogen promotes an adaptive UPR response that protects cells against subsequent UPR-mediated apoptosis. Analysis of data from ERα(+) breast cancers demonstrates elevated expression of a UPR gene signature that is a powerful new prognostic marker tightly correlated with subsequent resistance to tamoxifen therapy, reduced time to recurrence and poor survival. Thus, as an early component of the E2-ERα proliferation program, the mitogen estrogen, drives rapid anticipatory activation of the UPR. Anticipatory activation of the UPR is a new role for estrogens in cancer cell proliferation and resistance to therapy.


Conflict of interest statement

CONFLICTS OF INTEREST

The authors declare no conflicts of interest.

Figures

Figure 1
Figure 1
E2-ERα activates the IRE1α and ATF6α arms of the UPR in breast and ovarian cancer cells, resulting in the induction of the major EnR chaperone, BiP. (a) qRT-PCR comparing the effect of estrogen (E2), ICI 182,780 (ICI) and 4-hydroxytamoxifen (4-OHT) on E2-ERα induction of spliced-XBP1 (sp-XBP1) in ERα+T47D breast cancer cells (n = 3; −E2 set to 1). Different letters indicate a significant difference among groups (p < 0.05) using one-way ANOVA followed by Tukey’s post hoc test. (b) qRT-PCR showing the effect of E2-ERα on sp-XBP1 mRNA in ERα+MCF-7 breast and PEO4 ovarian cancer cells (n = 3; −E2 set to 1). P-values testing for significance between indicated group and -E2 group. (c) RNAi knockdown of ERα abolishes E2-induction of sp-XBP1 in MCF-7 cells (n = 3). Cells treated with 100 nM non-coding control (NC) or ERα siRNA SmartPool, followed by treatment with E2 for the indicated times (d) Western blot analysis showing full-length 90 kDa ATF6α (p90-ATF6α) and proteolytically cleaved 50 kDa ATF6α (p50-ATF6α) in E2-treatedT47D breast cancer cells. (e) RNAi knockdown of ATF6α blocks E2-induction of BiP in T47D cells. Cells treated with 100 nM non-coding control (NC) or ATF6α siRNA SmartPool, followed by treatment with E2 for 4 hours. (f) qRT-PCR showing the effect of E2 on BiP mRNA in MCF-7 cells and in PEO4 ovarian cancer cells (n = 3; −E2 set to 1). (g) Western blot analysis of BiP protein levels in MCF-7 cells treated with E2. The fold-change in BiP protein levels is shown below each lane and was determined by quantifying BiP and β-Actin signals, and calculating the ratio of BiP/β-Actin (t=0, [−E2], set to 1). (h) RNAi knockdown of ERα abolishes E2-induction of BiP in MCF-7 cells (n = 3). Cells treated with 100 nM non-coding control (NC) or ERα siRNA SmartPool, followed by treatment with E2 for the indicated times. Concentrations: E2, 1 nM (a, d), 10 nM (b, c, e–h); ICI, 1 μM (a, d); 4-OHT, 1 μM (a). Data is mean ± S.E.M. * p < 0.05; ** p < 0.01; *** p< 0.001.
Figure 2
Figure 2
E2-ERα activates the PERK arm of the UPR. Western blot analysis showing (a) p-PERK and total PERK levels and (b) p-eIF2α levels and total eIF2α levels in ERα+ T47D cells treated with ICI 182,780 (ICI) or a vehicle control for 2 hours, followed by treatment with 10 nM 17β-estradiol (E2) (n = 3). Numbers below each lane are the ratio of p-PERK/PERK or p-eIF2α/eIF2α normalized to the vehicle-treated control. (c) Protein synthesis in T47D breast cancer cells treated with ICI 182,780 (ICI) or a vehicle control for 2 hours, followed by treatment with 10 nM 17β-estradiol (E2) (n = 3). P-values testing for significance between indicated groups and -E2 samples. (d) PERK knockdown inhibits downstream phosphorylation of eIF2α in T47D cells. Cells treated with 100 nM non-coding control (NC) or PERK siRNA SmartPool, followed by treatment with E2 (+E2) or ethanol-vehicle (−E2) for 4 hours. (e) Western blot analysis of ATF4 following treatment of T47D cells with E2, or the UPR activator tunicamycin (TUN). (f) qRT-pCR analysis of CHOP mRNA following treatment of T47D cells with E2. Brackets denote pre-treatment with ICI for 2 hours. Concentrations: E2, 1 nM (a–f); ICI, 1 μM (a, b, c); TUN, 10 μg/mL (e). Data is mean ± SEM. * p<0.05; ** p<0.01; *** p< 0.001; ns, not significant.
Figure 3
Figure 3
Estrogen stimulates the release of calcium from the endoplasmic reticulum, and this calcium release is necessary for UPR activation. (a) Effects of 300 nM estrogen (E2) on cytosolic calcium levels in T47D breast cancer cells conditioned in the presence (2 mM CaCl2) or absence (0 mM CaCl2) of extracellular calcium, or cells pre-treated with 2-APB or ryanodine (Ry) for 30 minutes in the absence of extracellular calcium (0 mM CaCl2). Visualization of intracellular Ca2+ using Fluo-4 AM. Colors from basal Ca2+ to highest Ca2+: Blue, green, red, white. (b) Graph depicts quantitation of cytosolic calcium levels in T47D breast cancer cells treated with E2 in the presence or absence of extracellular calcium, and in cells pre-treated with 2-APB or ryanodine (Ry) in the absence of extracellular calcium (n = 10 cells). E2 was added at 60 sec, and fluorescence intensity prior to 60 sec was set to 1. (c) Western blot analysis of IP3R and BiP protein levels following treatment of T47D cells with either 100 nM non-coding (NC) or IP3R siRNA SmartPool, followed by treatment with E2 (+E2) or ethanol-vehicle (−E2) for 4 hours. IP3R smartpool contained equal amounts of three individual SmartPools directed against each isoform of IP3R. (d) Quantitation of cytosolic Ca2+ levels in response to E2, following treatment of T47D cells with 100 nM non-coding (NC) or IP3R siRNA SmartPool (n = 10 cells) (e) Western blot analysis of PLCγ, BiP, and ATF6α protein levels after treatment of T47D cells with 100 nM non-coding (NC) or PLCγ siRNA SmartPool, followed by treatment with E2 (+E2) or ethanol-vehicle (−E2) for 4 hours. (f) Quantitation of cytosolic Ca2+ levels in response to E2, following treatment of T47D cells with 100 nM non-coding (NC) or PLCγ siRNA SmartPool. (g) Western blot analysis of ERα protein levels after treating T47D cells with either 100 nM non-coding (NC) or ERα siRNA SmartPool, followed by treatment with E2 (+E2) or ethanol-vehicle (−E2) for 4 hours. (h) Visualization and quantitation of cytosolic Ca2+ levels in response to E2 after ERα knockdown in T47D cells. Concentrations: E2, 300 nM (a, b, d, f, h), 1 nM (c, e, g); 2-APB, 200 μM (a, b); ryanodine, 200 μM (a, b). Graphical data is mean ± SE (n = 10).
Figure 4
Figure 4
E2-ERα induced calcium release from the EnR into the cytosol is important for E2-ERα mediated gene expression and E2-ERα stimulated cell proliferation. (a) E2-ERα stimulated proliferation of T47D breast cancer cells treated with 100 nM non-coding (NC), PLCγ, IP3R, or ATF6α siRNA SmartPool (n = 6). Proliferation rates were normalized to cells treated with non-coding (NC) siRNA. (b) E2-ERα stimulated proliferation of T47D breast cancer cells treated with ryanodine (Ry), 2-APB, or both inhibitors (Ry + 2-APB) for 4 days (n = 5). (c) qRT-PCR analysis of effects of IP3R knockdown on E2-ERα induction of GREB1 mRNA in T47D cells (n = 3). Western blot shows ERα protein levels after treatment of T47D cells with 100 nM non-coding (NC) or IP3R siRNA SmartPool, followed by treatment with E2 (+E2) or ethanol-vehicle (−E2) for 4 hours. (d) ERE-luciferase activity in kBluc-T47D breast cancer cells treated with E2 and either ryanodine (Ry), 2-APB, or both inhibitors for 24-hours (Ry + 2-APB) (n = 4). (e) E2-ERα stimulated proliferation of MCF-7 breast cancer cells treated 100 nM non-coding (NC), PLCγ, IP3R, ATF6α, XBP1, or PERK siRNA SmartPool (n = 6). Proliferation rates were normalized to cells treated with non-coding (NC) siRNA. (f) qRT-PCR analysis of effects of ryanodine (Ry), 2-APB, or both inhibitors (Ry + 2-APB) on E2-ERα induction of pS2 mRNA in MCF-7 cells (n = 3). (g) Model of E2-ERα acting through the UPR to influence breast tumorigenesis.“•” denotes cell number at day 0. Concentrations: E2, 100 pM (a–f); 2-APB, 200 μM (b, d, f); Ryanodine, 100 μM (b, d, f). Data is mean ± SEM. Different letters indicate a significant difference among groups (p < 0.05) using one-way ANOVA followed by Tukey’s post hoc test. ns, not significant.
Figure 5
Figure 5
E2-ERα activity and UPR activity are correlated in vivo. (a) qRT-PCR analysis of levels of mRNAs for each arm of the UPR after treatment of MCF-7 cells with 10 nM E2 for the indicated times (n = 3). (b) MCF-7 tumor growth in the presence or absence of estrogen in athymic mice. All mice were treated with estrogen to induce tumor formation. On “Day 0”, E2 in silastic tubes was replaced with silastic tubes containing only cholesterol in the –E2 group (n = 15), while silastic tubes were retained in the +E2 treatment group (n = 15). qRT-PCR analysis of (c) classical E2-ERα regulated genes and (d) the UPR in mouse tumors collected after 24 days of exposure to estrogen (+E2) or vehicle-control (−E2) (n = 15). Relative mRNA levels of (e) classical E2-ERα regulated genes and (f) the UPR pathway in patient samples of normal breast epithelium taken from patients undergoing reduction mammoplasty (RM) (n = 18), histologically normal breast epithelium taken from patients diagnosed with invasive ductal carcinoma (IDC) (n = 9), and carcinoma epithelium taken from IDC patients (n = 20). p-values represent comparisons to –E2 groups (a, c, d) or to histologically normal breast epithelium from patients who underwent reduction mammoplasty (e, f). Data is mean ± SEM. * P <0.05; ** P <0.01; ***P < 0.001; ns, not significant.
Figure 6
Figure 6
Anticipatory activation of the UPR by estrogen protects cells from subsequent cell stress, and expression of the UPR gene signature predicts relapse-free and overall survival in ERα positive breast tumor cohorts. (a) Weak anticipatory activation of the UPR with estrogen or tunicamycin protects cells from subsequent UPR stress. T47D cells were maintained in 10% CD-FBS for 8 days and treated with either 250 ng/ml tunicamycin (TUN), 100 pM E2, or ethanol/DMSO-vehicle (Untreated). E2, TUN, or the vehicle control were removed from medium, and cells were harvested in 10% CD-calf serum and treated with the indicated concentrations of tunicamycin. Data is mean ± SEM (n = 6). Different letters indicate a significant difference among groups (p < 0.05) using one-way ANOVA followed by Fisher’s LSD post hoc test. (b) Relapse-free survival as a function of the UPR gene signature for patients with ERα+ breast cancer who subsequently received tamoxifen alone for 5 years. Interquartile range used to assign tumors to risk groups, representing UPR activity from high to low. Hazard ratios are between low and medium and low and high UPR groups (n = 474). (c) Overall survival as a function of the UPR signature and clinical covariates (node status, tumor grade, ERα-status, tumor size). p-value is testing for significance between the combined model (UPR gene signature and clinical covariates) versus the covariates only model (multivariate analysis) (n = 236). (d) Univariate and multivariate Cox regression analysis of the UPR signature, clinical covariates, and classical estrogen-induced genes for time to recurrence and survival (n.s., not significant). Median used to classify tumors into high and low risk groups.

Similar articles

Cited by

References

    1. Korach KSDBJ. Estrogen receptors and human disease. J Clin Inv. 2006;116:561–571. - PMC - PubMed
    1. Musgrove EA, Sutherland RL. Biological determinants of endocrine resistance in breast cancer. Nat Rev Cancer. 2009;9:631–643. - PubMed
    1. Yue W, Yager JD, Wang JP, Jupe ER, Santen RJ. Estrogen receptor-dependent and independent mechanisms of breast cancer carcinogenesis. Steroids. 2013;78:161–170. - PubMed
    1. (EBCTCG). EBCTCG. Effects of chemotherapy and hormonal therapy for early breast cancer on recurrence and 15-year survival: an overview of the randomised trials. Lancet. 2005;365:1687–1717. - PubMed
    1. Jensen EV, Jordan VC. The estrogen receptor: a model for molecular medicine. Clin Cancer Res. 2003;9:1980–1989. - PubMed

Publication types

MeSH terms

Associated data