. 2014 Oct 9;9(1):261-271.
doi: 10.1016/j.celrep.2014.08.046. Epub 2014 Sep 25.

Hippo signaling influences HNF4A and FOXA2 enhancer switching during hepatocyte differentiation

Affiliations

Hippo signaling influences HNF4A and FOXA2 enhancer switching during hepatocyte differentiation

Olivia Alder et al. Cell Rep. .

Abstract

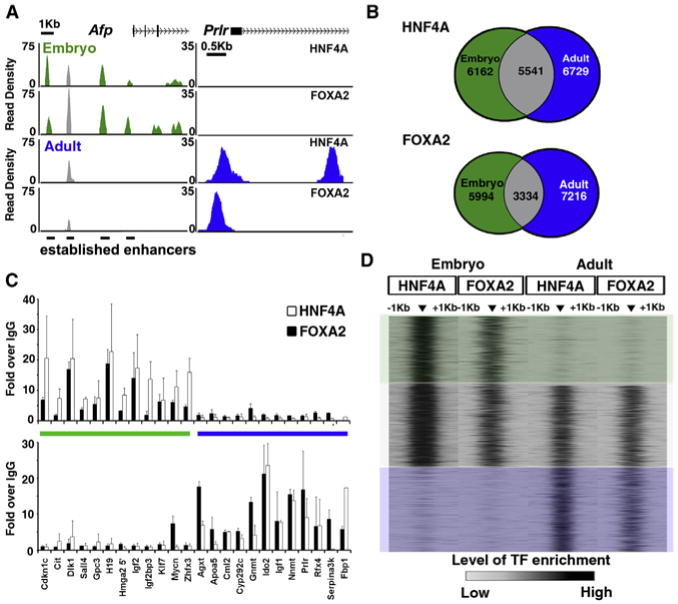
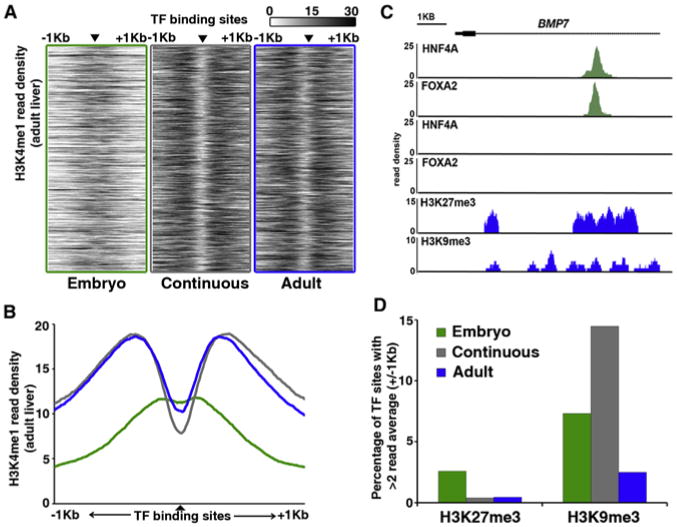
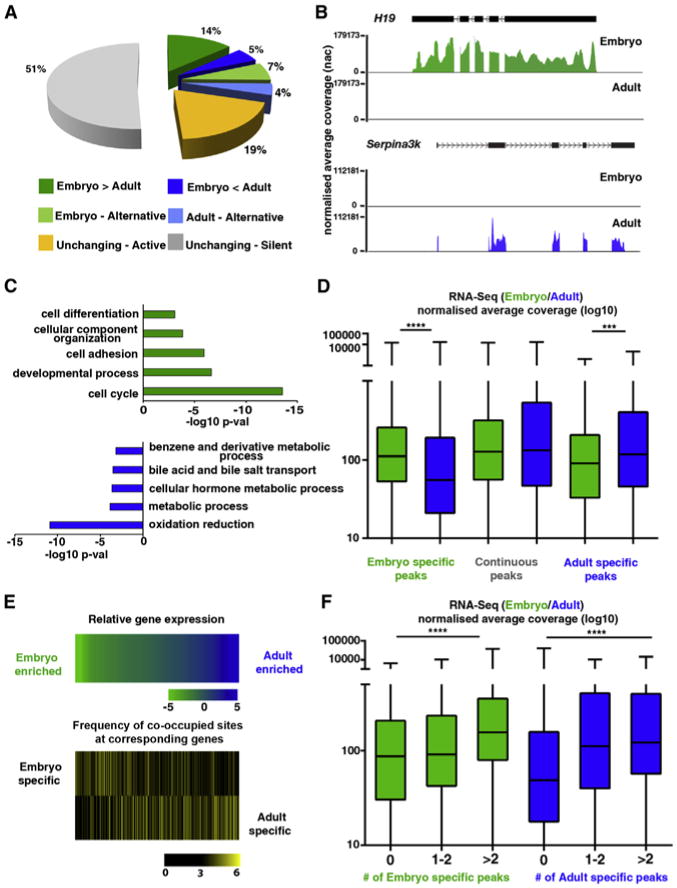
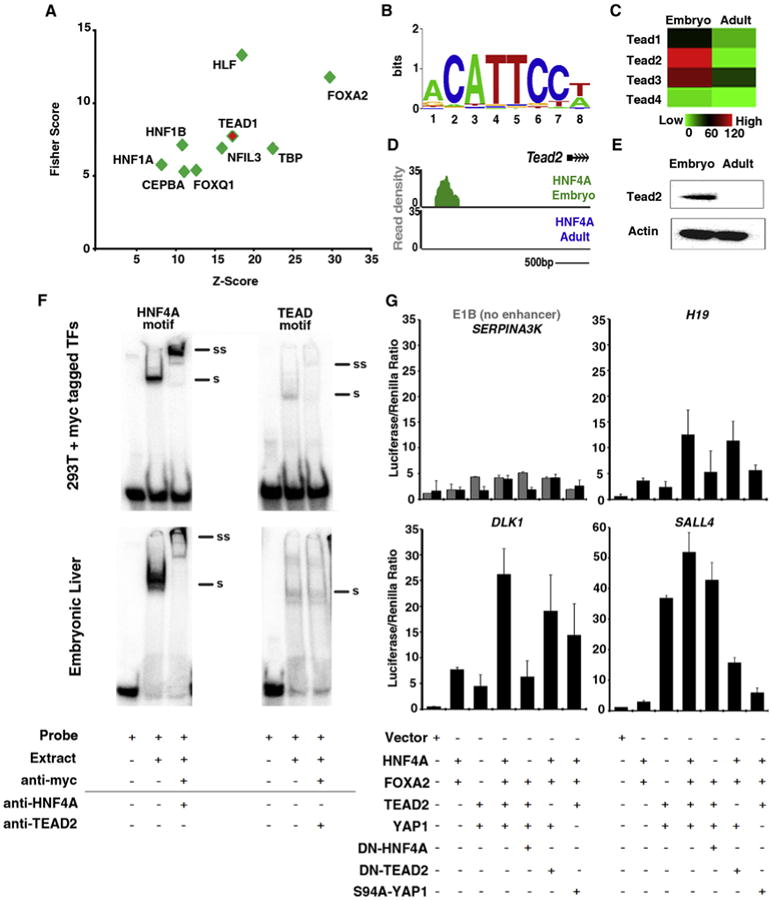
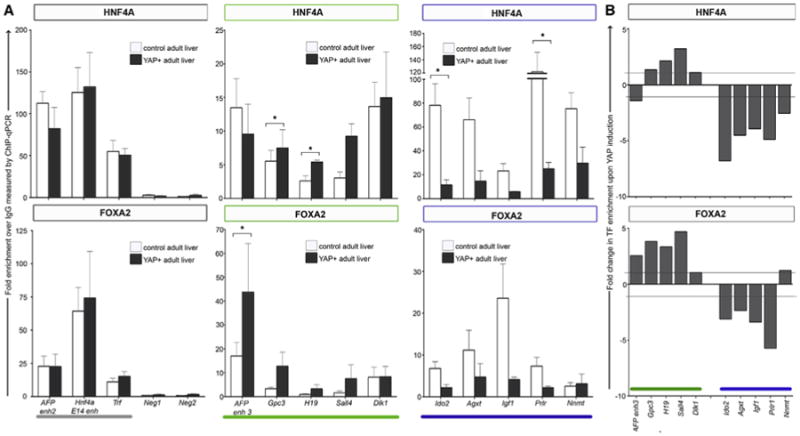
Cell fate acquisition is heavily influenced by direct interactions between master regulators and tissue-specific enhancers. However, it remains unclear how lineage-specifying transcription factors, which are often expressed in both progenitor and mature cell populations, influence cell differentiation. Using in vivo mouse liver development as a model, we identified thousands of enhancers that are bound by the master regulators HNF4A and FOXA2 in a differentiation-dependent manner, subject to chromatin remodeling, and associated with differentially expressed target genes. Enhancers exclusively occupied in the embryo were found to be responsive to developmentally regulated TEAD2 and coactivator YAP1. Our data suggest that Hippo signaling may affect hepatocyte differentiation by influencing HNF4A and FOXA2 interactions with temporal enhancers. In summary, transcription factor-enhancer interactions are not only tissue specific but also differentiation dependent, which is an important consideration for researchers studying cancer biology or mammalian development and/or using transformed cell lines.


Figures

Figure 1
Figure 1. HNF4A and FOXA2 ChIP-Seq in Purified Fetal Hepatoblasts
(A) Immunofluorescence analysis of cryosectioned mouse embryos at E14.5, showing colabeling of hepatoblasts with the cell-surface marker delta-like-1 (DLK1, green), hepatic nuclear factor 4a (HNF4A, red) and nuclei (DAPI, blue). Scale bar, 100 mm. (B) Venn diagram representing the number of called peaks (FindPeaks, FDR < 0.01) for FOXA2 (white) and HNF4A (black) In hepatoblast ChIP-seq data sets. Peaks with >50 bp shared FOXA2 and HNF4A were considered to be common sites of enrichment (gray). (C) GO enrichment analysis of shared target genes Selected statistically significant enriched pathways are shown and graphed using the binomial log10 p value on the y axis. (D) Read density histograms represent the enrichment of HNF4A and FOXA2 detected by ChIP-seq in embryonic hepatoblasts proximal to the hepatoblast biomarkers Gpc3 and Dlk1. See also Figure S1 and Table S1.
Figure 2
Figure 2. HNF4A and FOXA2 Co-occupy Target Sites in a Differentiation-Dependent Manner
(A) Read density histograms proximal to the Afp (left) and Prlr (right) locus, displaying HNF4A and FOXA2 ChIP-seq data sets generated from embryonic hepatoblasts (green) and adult hepatocytes (blue). (B) Venn diagram representing regions of enrichment in embryonic (green) and adult (blue) ChIP-seq data sets for HNF4A and FOXA2. Sites with >50 bp overlap between them were designated as common between data sets (gray). (C) ChIP-qPCR verification of sites defined as embryonic (green bar) or adult (blue bar); data are represented as mean ± SEM from duplicate experiments. (D) Heatmap representation of TF enrichment (black, high; gray, low) at all regions bound by both HNF4A and FOXA2 during at least one stage of liver development. Enrichment levels were profiled ±1 kb at a resolution of 50 bp from the peak center using SitePro in Galaxy/Cistrome toolbox. Boxes overlaying the heatmap highlight regions that were selected for further analysis and classified as embryonic only (green), continuous (gray), or adult only (blue). See also Figure S2.
Figure 3
Figure 3. Differentiation-Dependent Binding Sites Show Distinct Patterns of Enhancer-Associated H3K4me1
(A) Heatmap representation of H3K4me1 at regions bound by both HNF4A and FOXA2 (▲) in embryonic liver only (green, left), both embryonic and adult liver (gray, middle), or adult liver only (blue, right). Enrichment levels (white, low; black, high) were profiled ±1 kb at a resolution of 10 bp from the TF peak center, represented by the small black triangle. The vertical ordering of sites is random. (B) Average enrichment profiles of H3K4me1 at differentiation-dependent HNF4A and FOXA2 binding sites (green line, embryo; gray line, continuous; blue line, adult). (C) Read density histograms proximal to the BMP7 locus, displaying HNF4A and FOXA2 ChIP-seq data sets generated from embryonic hepatoblasts (green), and HNF4A, FOXA2, H3K27me3, and H3K9me3 ChIP-seq data sets generated from adult hepatocytes (blue). (D) Percentage of differentiation-dependent binding sites showing >2 average read enrichment for repressive histone modifications H3K27me3 or H3K9me3 within 2 kb regions surrounding TF-binding sites. See also Figure S3.
Figure 4
Figure 4. Differential Gene Expression during Hepatocyte Maturation Is Associated with Differentiation-Dependent HNF4A and FOXA2 Binding
(A) Representation of transcriptome proportions subject to differential regulation (>2-fold difference with a Pearson correlation of <0.05), alternative transcription (inclusion of different exons and/or untranslated regions) in embryonic hepatoblasts (green) and adult hepatocytes (blue), or consistent (<2-fold change, yelow) in transcript evels between embryonic hepatoblasts and adult liver. (B) RNA-seq profiles of the top-ranking differentially expressed genes (H19 and Serplna3k) in embryonic (green) and adult (blue) liver. (C) GO analysis of differentially expressed transcripts in embryonic (green) and adult (blue) liver. (D) Global expression levels in embryonic (green) and adult (blue) liver of putative target genes associated with HNF4A and FOXA2 in the embryo only (left), embryonic and adult liver (continuous, middle), or adult ony (right). The NAC is the cumulative base coverage of a feature normalized to feature length and library size, Significance was tested using Kruskal-Wallis one-way ANOVA with Dunn's post-test correction; ****p < 0.001, ***p < 0.005. Error bars in the boxplot represent minimum to maximum values. (E) In the upper panel, relative expression levels (log10) of genes targeted by HNF4A and FOXA2 In a differentiation-dependent manner are ranked as either embryo-enriched (green) or adult livar-enriched (blue). Intensity in bottom two heatmaps (black, low; yellow, high) reflects the average number of differentiation-dependent DNA-binding sites within associated enhancer promoter unit divided by the average number of sites in an EPU included in the analysis (see aso Figure S4). (F) Genes were categorized according to the associated number of differentiation-dependent enhancers and global gene expression levels were compared between those not bound specifically at the developmental stage indicated, targeted at one or two putative enhancers or bound at more than two sites. Significance was tested using Kruskal-Wallis one-way ANOVA with Dunn's post-test correction; ****p < 0.001. Error bars in the boxplot represent minimum to maximum values. See also Table S2.
Figure 5
Figure 5. TEAD2 Cooperates with HNF4A and FOXA2 at Developmentally Regulated Embryonic Enhancers
(A) Anchored combination site analysis using oPOSSUM. Motifs of expressed TFs enriched at embryonic enhancer regions were graphed according to Fisher and Z score values. (B) Composite position-weighted matrix of all identified TEAD1 motifs at embryonic enhancer regions, generated using STAMP. (C) Heatmap depicting NAC values for TEAD family members (red, high; green, low) in RNA-seq libraries made from DLK1 + hepatoblasts (Embryo) and adult liver (Adult). (D) Read density histogram proximal to the Tead2 locus, displaying HNF4A binding in embryonic hepatoblasts (green), but not in adult hepatocytes (blue). (E) Western blot analysis of protein isolated from embryonic (E14.5) and adult liver using anti-Tead2 and anti-actb. (F) Nuclear extracts were isolated from 293T cells expressing myc-tagged TF or from E14.5 liver and incubated with P32-labeled probes containing TF-binding motifs found at the enhancer region associated with Sall4 and 3 mg of anti-myc (top panel), anti-HNF4A, or anti-TEAD2. Note that a shift (denoted by a black bar and “S”) was detected with both probes and in both 293T and E14.5 extracts. A supershift (denoted by a black bar and “SS”) was detected using anti-myc and anti-HNF4A (due to the poor quality of the antibody, no supershift to endogenous protein could be detected using anti-TEAD2). (G) Embryonic enhancers containing TEAD motifs were cloned into luciferase vectors containing a minimal promoter (E1B) and transfected into 293T cells alongside a Renilla-containing construct. Expression vectors for HNF4A, FOXA2, TEAD2, YAP1, dominant-negative HNF4A (DN-HNF4A), DN-TEAD2, and mutant YAP (S94A YAP1) were cotransfected in different combinations. Luciferase assays were conducted 48 hr after transfection. Data shown are from duplicate experiments are represented as mean ± SEM. See also Figure S5.
Figure 6
Figure 6. Ectopic Expression of YAP1 in Adult Liver Induces Changes in HNF4A- and FOXA2-DNA Binding
ChIP-qPCR analysis of HNF4A (top panel) and FOXA2 (lower panel) in control (white) and YAP-induced (gray) adult liver. (A) TF enrichment is expressed as fold over control immunoprecipitation (normal rabbit IgG). The gray bar Indicates regions previously shown to be bound in both embryonic and adult liver (AFP enh2, HNF4a, and TRF). Neg1 and Neg2 function as negative control regions in which no enrichment was expected. Afp enh3, Gpc3, H19, Sall4, and Dlk1 (green bar) represent regions previously shown to be exclusively occupied in embryonic liver. Ido2, Agxt, Igf1, Prlr, and Nnmt (blue bar) represent regions previously shown to be exclusively occupied in adult liver. Data are represented as mean ± SEM from triplicate experiments. Multiple t tests were conducted to determine significance (*p < 0.05). (B) ChIP-PCR analysis represented as fold change between control = 1 and YAP-induced liver.

References

    1. Ashburner M, Ball CA, Blake JA, Botstein D, Butler H, Cherry JM, Davis AP, Dolinski K, Dwight SS, Eppig JT, et al. The Gene Ontology Consortium. Gene Ontology: tool for the unification of biology. Nat Genet. 2000;25:25–29. - PMC - PubMed
    1. Battle MA, Konopka G, Parviz F, Gaggl AL, Yang C, Sladek FM, Duncan SA. Hepatocyte nuclear factor 4alpha orchestrates expression of cell adhesion proteins during the epithelial transformation of the developing liver. Proc Natl Acad Sci USA. 2006;103:8419–8424. - PMC - PubMed
    1. Blankenberg D, Von Kuster G, Coraor N, Ananda G, Lazarus R, Mangan M, Nekrutenko A, Taylor J. Galaxy: a web-based genome analysis tool for experimentalists. Curr Protoc Mol Biol. 2010;Chapter 19 Unit 19.10.1-2. - PMC - PubMed
    1. Bochkis IM, Schug J, Rubins NE, Chopra AR, O'Malley BW, Kaestner KH. Foxa2-dependent hepatic gene regulatory networks depend on physiological state. Physiol Genomics. 2009;38:186–195. - PMC - PubMed
    1. Buecker C, Srinivasan R, Wu Z, Calo E, Acampora D, Faial T, Simeone A, Tan M, Swigut T, Wysocka J. Reorganization of enhancer patterns in transition from naive to primed pluripotency. Cell Stem Cell. 2014;14:838–853. - PMC - PubMed

Publication types

MeSH terms

Substances

Associated data