. 2014 Oct 2;56(1):104-15.
doi: 10.1016/j.molcel.2014.08.028. Epub 2014 Sep 25.

mRNA destabilization is the dominant effect of mammalian microRNAs by the time substantial repression ensues

Affiliations

mRNA destabilization is the dominant effect of mammalian microRNAs by the time substantial repression ensues

Stephen W Eichhorn et al. Mol Cell. .

Abstract

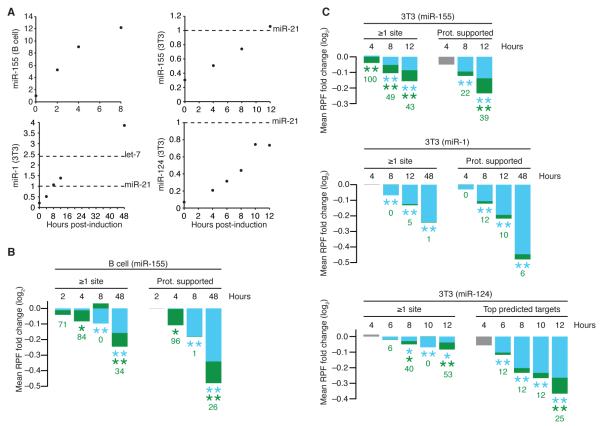
MicroRNAs (miRNAs) regulate target mRNAs through a combination of translational repression and mRNA destabilization, with mRNA destabilization dominating at steady state in the few contexts examined globally. Here, we extend the global steady-state measurements to additional mammalian contexts and find that regardless of the miRNA, cell type, growth condition, or translational state, mRNA destabilization explains most (66%->90%) miRNA-mediated repression. We also determine the relative dynamics of translational repression and mRNA destabilization for endogenous mRNAs as a miRNA is induced. Although translational repression occurs rapidly, its effect is relatively weak, such that by the time consequential repression ensues, the effect of mRNA destabilization dominates. These results imply that consequential miRNA-mediated repression is largely irreversible and provide other insights into the nature of miRNA-mediated regulation. They also simplify future studies, dramatically extending the known contexts and time points for which monitoring mRNA changes captures most of the direct miRNA effects.


Figures

Figure 1
Figure 1. Steady-State Changes in Gene Expression Due to miRNAs
(A) The influence of using different types of mRNA enrichment when measuring the effects of miRNAs on mRNA levels and TE. Plots show cumulative distributions of changes in RPFs (top), mRNA (middle), and TE (bottom) after transfection of either miR-1 (left) or miR-155 (right) into U2OS cells. The impact of the miRNA on genes with at least one site to the cognate miRNA in their 3′ UTR (≥1 site; n = 1321 and 1075 for miR-1 and miR-155, respectively) is compared to that of control genes (no site; n = 1205 and 1056, respectively), which were chosen from the genes with no site to the cognate miRNA throughout their entire transcript to match the 3′-UTR-length distributions of site-containing genes. The three types of mRNA enrichment were poly(A)-selected total RNA, poly(A)-selected cytoplasmic RNA, and tRNA/rRNA-depleted total RNA [total p(A), cyto p(A), and Ribo-zero, respectively]. RNA-seq analyses of these preparations were used to calculate mRNA and TE changes, with results plotted as indicated in the key. Data were normalized to the median changes observed for the controls. See also, Figure S1. (B) A simplified representation of the results in panel A showing for each experiment the mean RPF fold change (log2) attributable to changes in mRNA (blue) and TE (green), after subtracting the mean RPF change of the no-site control genes. The bars for the percent contribution attributable to mRNA and TE changes are calculated using the mean RNA and RPF fold changes (log2) after normalizing to the median no-site fold change (log2) (Figure S2). The schematic (left) depicts the components of the compound bar graphs (right). Significant changes for each component are indicated with asterisks of the corresponding color [*, P ≤0.05; **, P ≤0.001, one-tailed Kolmogorov–Smirnov test (K–S test)], with the relative contribution of TE to repression (Figure S2D) reported as a percentage in green below each bar. See also, Figure S2. (C) The steady-state effects of miRNAs in a variety of cell types, shown using compound bar graphs like those of panel B. For comparison with our current results, previously published results from HeLa and neutrophils (neut.) (Guo et al., 2010) are also plotted after reanalysis using the current methods (including the method for choosing no-site control cohorts). When available, proteomics-supported predicted targets were also analyzed (right). For HeLa and neutrophil these were the ones selected previously (Guo et al., 2010), and for the other samples these were selected from our proteomics data as the subset of site-containing genes with fold changes (log2) ≤−0.3 in the presence of the miRNA. Experiments with cell lines compared cells with and without the miRNA introduced by either transfection (HeLa and 293T) or induction from a transgene (3T3). Experiments with B cells, neutrophils and liver compared cells/tissues isolated from wild-type and miRNA-knockout mice. The hours indicate the time following transfection (HeLa and 293T), induction (3T3), or activation (B cells). See also, Figure S3, Table S1 and Table S2. (D) Comparison of mRNA and RPF changes for individual genes analyzed in panels (A)–(C). For U2OS cells, the results for the poly(A)-selected cytoplasmic RNA are shown. The dashed line is for y = x; the vertical and horizontal lines indicate the mean fold changes for the correspondingly colored groups of genes. Red, genes with ≥1 3′-UTR site to the cognate miRNA; grey, no site to the miRNA selected as in panel A; green, proteomics-supported predicted targets (Table S1 and Table S2). Data were normalized to the median changes observed for the controls. A comparable analysis of the HeLa and neutrophil data has been published (Guo et al., 2010).
Figure 2
Figure 2. Minor Impact of Translational Repression at all Times in Mammalian Cells
(A) Induction of miRNAs in activated murine B cells and in contact-inhibited NIH3T3 cells engineered to inducibly express miR-1, miR-124, or miR-155. Induction was monitored using RNA blots, probing for the induced miRNA. For samples from B cells, the membrane was reprobed for endogenous U6 snRNA, which served as a loading control for normalization, and expression is plotted relative to that of the non-activated cells. For samples from 3T3 cells, synthetic standards for the induced miRNAs and endogenous miR-21 were included on the blot, and used for absolute quantification. Expression is plotted relative to that of miR-21, with relative expression of the let-7 family (inferred from small-RNA sequencing data) also shown. (B) The contributions of mRNA decay and translational repression following miR-155 induction in primary murine B cells. The same sets of site-containing and control genes are analyzed in all time points. If the contribution of TE was calculated to be less than 0, the value reported below the bar was 0. Otherwise, as in Figure 1C. The 48 h time point is replotted from Figure 1C and was from a preparation of cultured B cells independent from that used for the earlier time points. See also, Table S2. (C) The contributions of mRNA decay and translational repression following induction of miR-155 (top), miR-1 (middle), or miR-124 (bottom) in the corresponding contact-inhibited 3T3 cell lines. In the absence of proteomics data for miR-124, the top 100 site-containing genes, as ranked by total context+ score (Garcia et al., 2011) regardless of site conservation, were analyzed to focus on a subset of site-containing genes likely to be regulated by miR-124. Otherwise, as in panel B. The miR-1 48 h time point is replotted from Figure 1C and is from the same experiment as the earlier time points. See also, Table S1 and Table S3.
Figure 3
Figure 3. Negligible Influence of Translational Stress or State on the Repression Mode
(A) Polysome profiles showing the translational activity of actively dividing (left), contact-inhibited (middle), and Torin1-treated contact-inhibited (right) miR-1 inducible 3T3 cells. Profiles are normalized to the monosome peak, with the polysome-to-monosome ratio (P:M) indicated. (B) The contributions of mRNA decay and translational repression following miR-1 or miR-155 induction in the corresponding 3T3 cell lines in the indicated states. Otherwise, as in Figure 2C. Results for contact-inhibited 3T3 cells expressing miR-1 and miR-155 were recalculated so as to only consider site-containing and no-site genes present in all samples. Abbreviations: Act., actively dividing; C.I., contact-inhibited; Torin, contact-inhibited and Torin1-treated; ≥1 s, genes with at least one site to the cognate miRNA in their 3′ UTR; Prot., proteomics-supported predicted targets. See also, Figure S4.
Figure 4
Figure 4. Simulated Dynamics of miRNA-Mediated Repression
(A) Simulation of rapid miRNA induction that begins with no miRNA and rises to a concentration exceeding that of the highest expressed endogenous miRNA in 3T3 cells within 6 h. (B) Changes in target mRNA (blue), TE (green), RPF (black), and protein (red; solid line, 10 h protein half-life; dashed line, 100 h protein half-life) levels resulting from the miRNA induction in panel A. (C) The relative contributions of mRNA decay and translational repression to the overall repression in panel A, when measured at either the RPF level (dark blue and dark green, respectively) or the protein level (light blue and light green; solid lines, 10 h protein half-life; dashed lines, 1 h protein half-life).

References

    1. Baek D, Villen J, Shin C, Camargo FD, Gygi SP, Bartel DP. The impact of microRNAs on protein output. Nature. 2008;455:64–71. - PMC - PubMed
    1. Bagga S, Bracht J, Hunter S, Massirer K, Holtz J, Eachus R, Pasquinelli AE. Regulation by let-7 and lin-4 miRNAs results in target mRNA degradation. Cell. 2005;122:553–563. - PubMed
    1. Bartel DP. MicroRNAs: target recognition and regulatory functions. Cell. 2009;136:215–233. - PMC - PubMed
    1. Bazzini AA, Lee MT, Giraldez AJ. Ribosome profiling shows that miR-430 reduces translation before causing mRNA decay in zebrafish. Science. 2012;336:233–237. - PMC - PubMed
    1. Behm-Ansmant I, Rehwinkel J, Doerks T, Stark A, Bork P, Izaurralde E. mRNA degradation by miRNAs and GW182 requires both CCR4:NOT deadenylase and DCP1:DCP2 decapping complexes. Genes Dev. 2006;20:1885–1898. - PMC - PubMed

Publication types