. 2014 Sep 29;9(9):e106291.
doi: 10.1371/journal.pone.0106291. eCollection 2014.

Electroencephalographic variation during end maintenance and emergence from surgical anesthesia

Affiliations

Electroencephalographic variation during end maintenance and emergence from surgical anesthesia

Divya Chander et al. PLoS One. .

Abstract

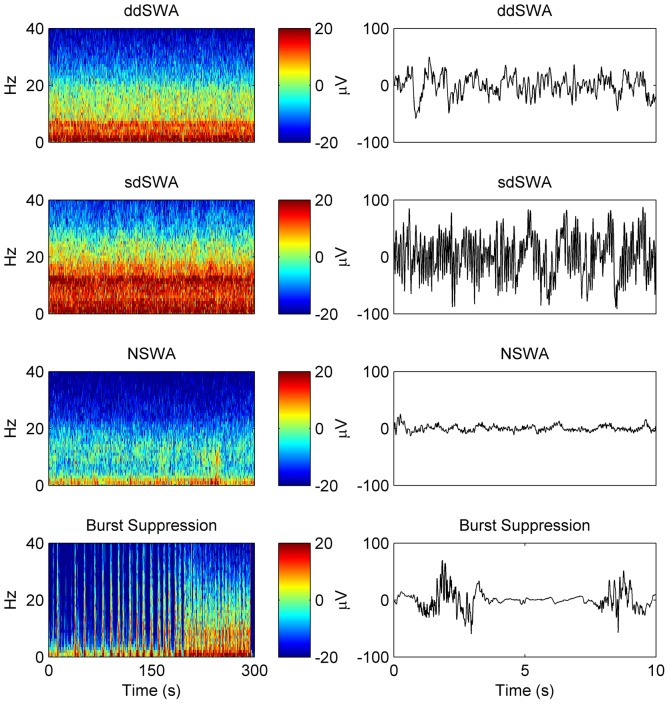
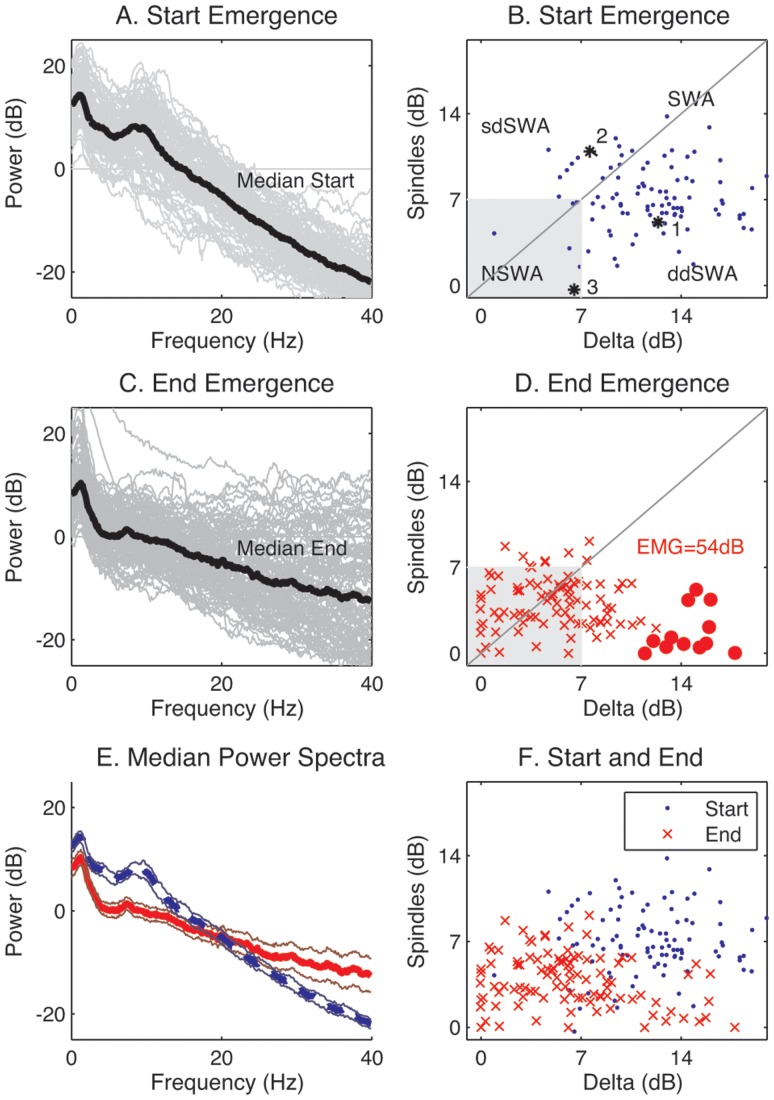
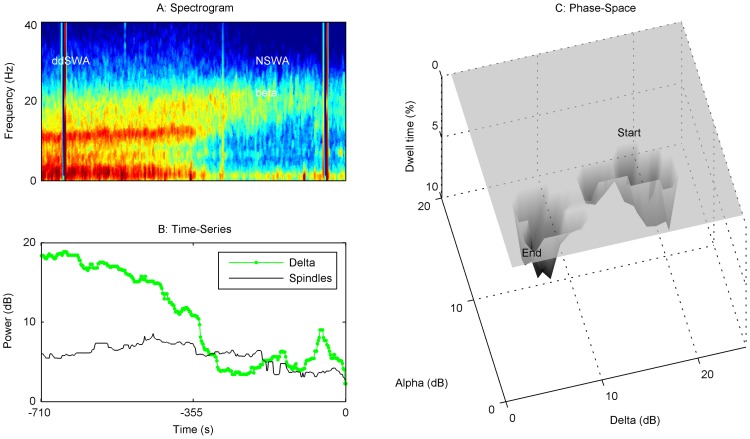
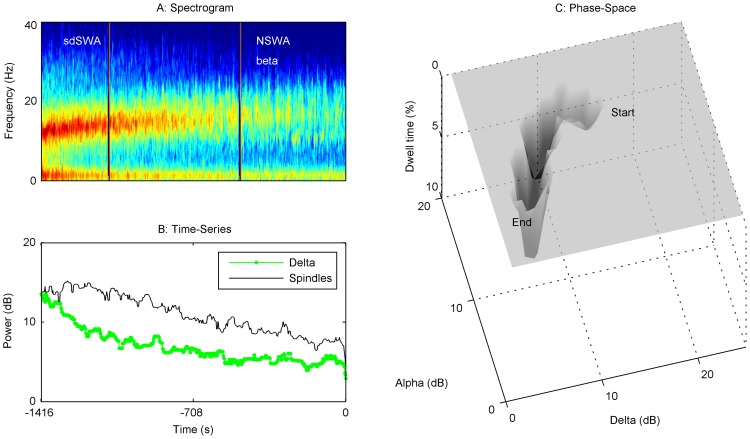
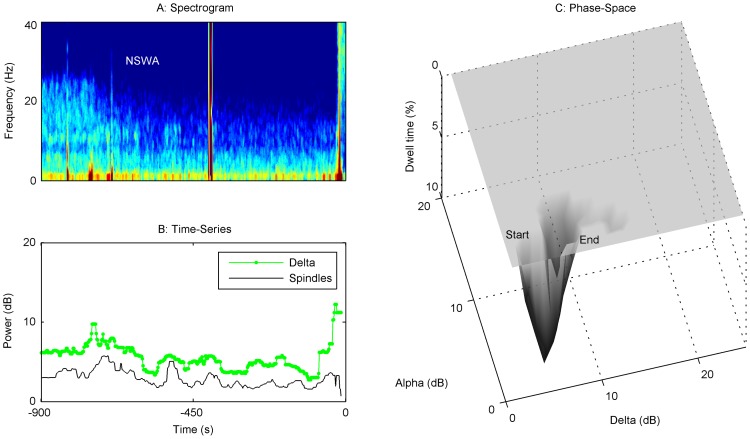
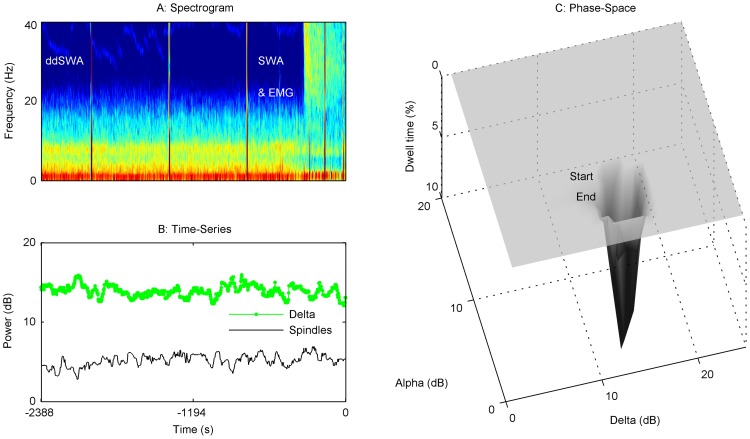
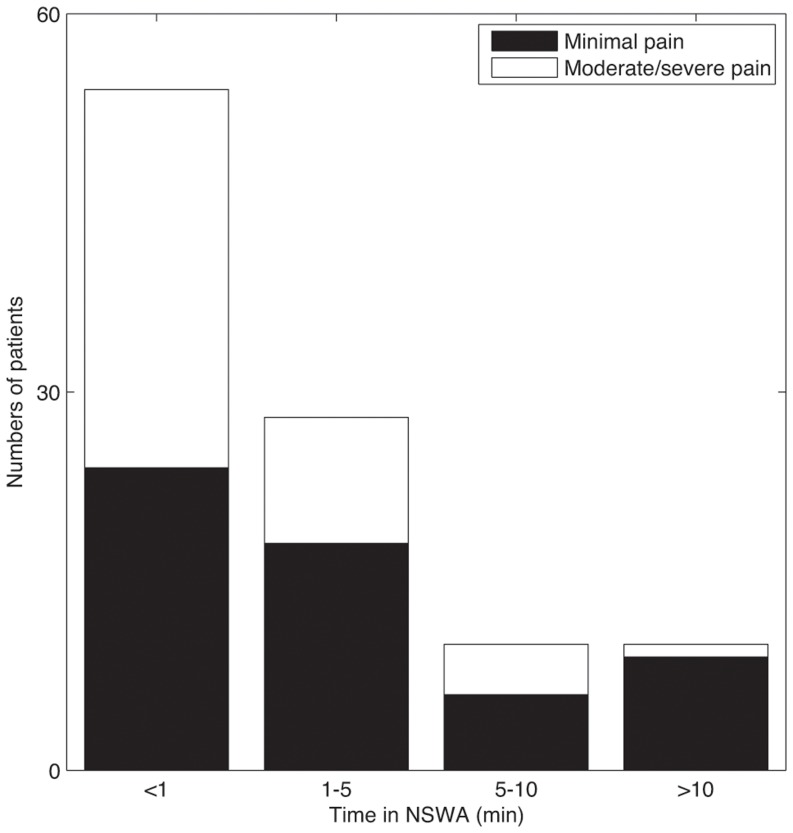
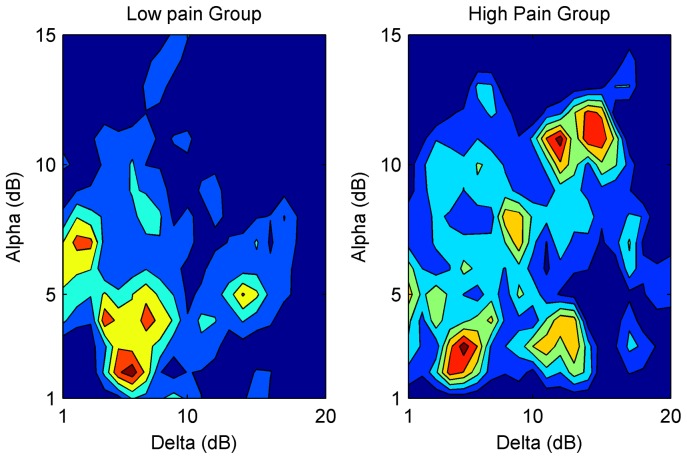
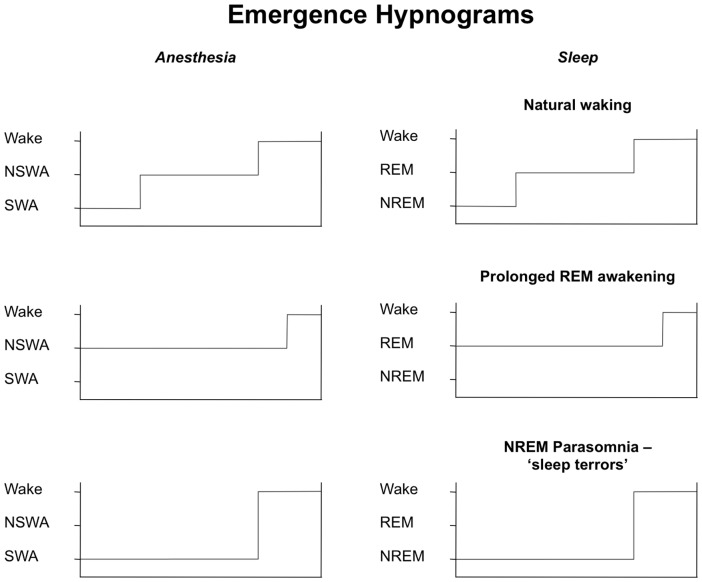
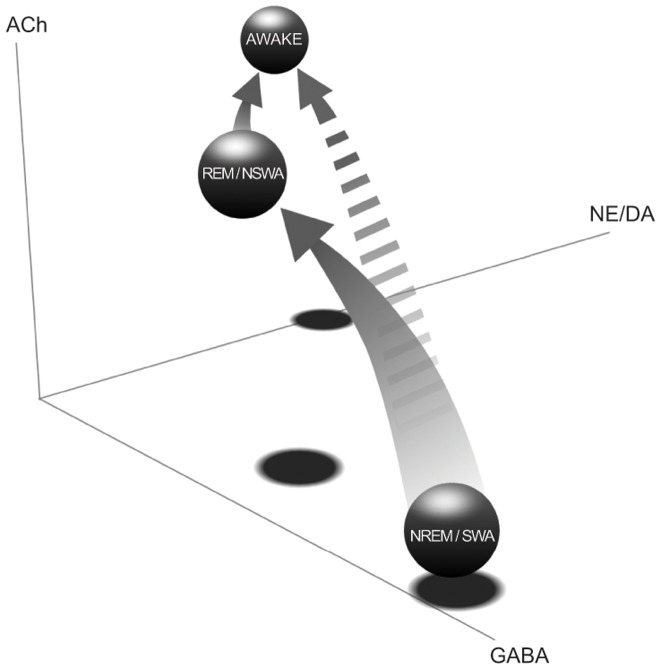
The re-establishment of conscious awareness after discontinuing general anesthesia has often been assumed to be the inverse of loss of consciousness. This is despite the obvious asymmetry in the initiation and termination of natural sleep. In order to characterize the restoration of consciousness after surgery, we recorded frontal electroencephalograph (EEG) from 100 patients in the operating room during maintenance and emergence from general anesthesia. We have defined, for the first time, 4 steady-state patterns of anesthetic maintenance based on the relative EEG power in the slow-wave (<14 Hz) frequency bands that dominate sleep and anesthesia. Unlike single-drug experiments performed in healthy volunteers, we found that surgical patients exhibited greater electroencephalographic heterogeneity while re-establishing conscious awareness after drug discontinuation. Moreover, these emergence patterns could be broadly grouped according to the duration and rapidity of transitions amongst these slow-wave dominated brain states that precede awakening. Most patients progressed gradually from a pattern characterized by strong peaks of delta (0.5-4 Hz) and alpha/spindle (8-14 Hz) power ('Slow-Wave Anesthesia') to a state marked by low delta-spindle power ('Non Slow-Wave Anesthesia') before awakening. However, 31% of patients transitioned abruptly from Slow-Wave Anesthesia to waking; they were also more likely to express pain in the post-operative period. Our results, based on sleep-staging classification, provide the first systematized nomenclature for tracking brain states under general anesthesia from maintenance to emergence, and suggest that these transitions may correlate with post-operative outcomes such as pain.


Conflict of interest statement

Competing Interests: The authors have declared that no competing interests exist.

Figures

Figure 1
Figure 1. Spectral patterns at the end of maintenance under sevoflurane general anesthesia comprise 4 basic patterns.
‘Slow-Wave Anesthesia’ (SWA) is a spectral pattern in which there is both high delta and spindle power (>7 dB). Panel (A) shows the more common variant, or subclass, of the SWA spectrogram, calculated over 5 minutes prior to turning off the anesthetic, in which delta power is higher than spindle power (point #1 below the diagonal in Figure 2B) termed delta dominant SWA, or ddSWA. An example 10 second raw EEG tracing is take from this period and shown in the right column. Panel (B) is an SWA spectral variant/subclass in which spindle power is higher than delta power, termed spindle-dominant SWA, or sdSWA (point #2 above the diagonal in Figure 2B). Finally, a small subset of patients (5%) showed low amplitude power in both the spindle and delta frequency bands (C). We termed this pattern non Slow-Wave Anesthesia, or NSWA (point #3 in Figure 2B). For completeness, the spectrogram in panel (D) reflects a deeper anesthetic maintenance pattern, burst suppression, transitioning into a ddSWA pattern at approximately 1.5 minutes prior to End Maintenance. The representative 10 second EEG to its right is taken from the burst suppression period.
Figure 2
Figure 2. Emergence from general anesthesia is characterized by a loss in power in the slower spindle and delta frequency bands, and a recovery of power in the higher frequency bands.
Power spectra and scatterplots of delta and spindle power (dB) for all patients, at the start (2A, 2B) and the end (2C, 2D) of emergence. The thick black lines are the median of the power spectra at each frequency for all patients. The median power spectra and 95% confidence intervals of the median, at the start and end, are shown in 2E. Patients were separated into two main spectral classes by thresholding spindle and delta power at 7 dB, whose boundary is marked by the gray box (see also Figure S1). Thus, the most common pattern, seen in 95% patients at Start Emergence, is characterized by high power (>7 dB) in both frequency bands, which we define as ‘Slow-Wave Anesthesia (SWA)’; the alternate pattern, defined as ‘Non Slow-Wave Anesthesia (NSWA)’, represents the 5% of patients that fall within the gray box. The fuzzy clusters in 2B are defined in the text: SWA  =  Slow-Wave Anesthesia, ddSWA  =  delta-dominant Slow-Wave Anesthesia, sdSWA  =  spindle-dominant Slow-Wave Anesthesia, NSWA  =  Non Slow-Wave Anesthesia (gray box). Red circles in 2D are those patients with a high delta power at End Emergence. All except one subject with high delta at End Emergence also had an EMG>40 dB. 2F is the same as 2B and 2D superimposed for ease of visual comparison.
Figure 3
Figure 3. Emergence Trajectory 1, SWA → NSWA.
The upper left panel (A) is the spectrogram from Start Emergence (measured in negative seconds) to End Emergence (time 0 seconds) for a representative patient (#81); this also corresponds to the time of anesthetic wash-out from the brain. Below it is a time series (B) that quantifies spindle and delta power (dB) over the same emergence period. To the right is a dwell time state-space plot (C). The evolution of spindle and delta power over the emergence trajectory from Start Emergence (upper right) to End Emergence (lower left) is shown where the depth of the contour (y-axis) reflects the time spent in each pixel of the state, as a percentage of the total emergence time. At the start of emergence, this patient remained for a signficant period in a slow-wave state (SWA) characterized by higher delta to spindle power ratio (ddSWA). There was a relatively abrupt transition period of approximately 60 seconds, to a second attractor characterized by lower delta and spindle power (NSWA) prior to waking-up. In our sample, 23% of patients had a similar trajectory.
Figure 4
Figure 4. Emergence Trajectory 2, SWA→NSWA, continuous progression.
The spectrogram (A) and time series (B) from Start Emergence to End Emergence for a representative patient (#36) are shown. To the right is dwell time state-space plot (C). This patient started in a slow-wave state (SWA). Over approximately 1.5 minutes, the patient transitioned into a state characterized by higher spindle power (sdSWA), and then showed a progressive decrease in delta and spindle power towards the NSWA region over about 20 minutes before waking. There was a converse increase in beta power as alpha/spindle power was diminished. No single deep attractor in state-space characterizes this patient's emergence path until reaching NSWA prior to wake-up. In our sample, 20% of patients had a similar trajectory.
Figure 5
Figure 5. Emergence Trajectory 3, NSWA→Wakefulness.
The spectrogram (A) and time series (B) from Start Emergence to End Emergence for a representative patient (#19) are shown. To the right is a dwell time state-space plot (C). This patient started and ended in a state characterized by a non slow-wave state (NSWA) attractor prior to waking up. The duration of emergence was long (15 minutes), and the attractor did not move significantly. In our sample, 16% of patients had a similar trajectory.
Figure 6
Figure 6. Emergence Trajectory 4, SWA→Wakefulness.
The spectrogram (A) and time series (B) from Start Emergence to End Emergence for a representative patient (77) are shown. To the right is a dwell time state-space plot (C). This patient started and ended in a state characterized by a slow-wave state (SWA) attractor prior to waking up. Patients who woke up this abruptly from a slow-wave state of anesthesia were more likely to experience high pain in recovery. In our sample, 31% of patients had a similar trajectory.
Figure 7
Figure 7. Increased time spent in a non slow-wave state (NSWA) during emergence is correlated with a lower nociceptive state.
Patients had a variable duration of emergence from the time the anesthetic was turned off, ranging from 2 minutes to more than 10 minutes, as well as a variable dwell-time in the state of NSWA. When divided into 4 groups based on NSWA dwell-time, patients that spent more time in NSWA prior to emerging were more likely to have minimal pain (PACU-pain  = 0, Table 1). Of the group that spent>10 minutes in NSWA prior to wake-up, 90% had minimal pain. Of the group that spent less than a minute in NSWA prior to wake-up, 44% had minimal pain (p = 0.037, Chi-squared test).
Figure 8
Figure 8. Patients with low pain scores (0) spend more time in a non slow-wave (NSWA) pattern during emergence while patients with higher pain scores (2) spend more time in a slow-wave pattern (SWA).
This is reflected in the averaged trajectories through the spindle-delta state space for the low (left panel) and high pain (right panel) groups. The heat map from blue to red reflects least to most time.
Figure 9
Figure 9. Hypnograms for emergence from general anesthesia and sleep.
Temporal evolution of stages of arousal during emergence from general anesthesia (GA) are plotted in the left column, and from sleep in the right column. Each GA hypnogram on the left reflects an identified Emergence Trajectory as defined earlier in the text. These trajectories might be loosely correlated with arousal trajectories from various stages of sleep that are placed immediately to the right. SWA  =  Slow-Wave Anesthesia, NSWA  =  Non Slow-Wave Anesthesia; NREM  =  non-REM sleep, REM  =  REM sleep.
Figure 10
Figure 10. A putative (shared) 3-D neurotransmitter state space for emergence from sleep and general anesthesia.
Based on spectral power and underlying neural generators, stages of anesthesia and stages of sleep may be analagous, especially on the path from thalamocortical hyperpolarization to waking. During natural NREM sleep, levels of GABA are high, while REM is characterized by high levels of both GABA and acetylcholine (ACh). As the brain passes from REM to waking, levels of GABA diminish, and monoamines such as norepinephrine and dopamine start to increase. The progression on the more typical anesthetic-emergence trajectory from SWA -> NSWA -> waking may reflect a similar shift in neurotransmitter balance as shown in this diagram (solid arrow). The “non-preferred” pathway of emergence that transitions directly from SWA -> waking (somewhat analagous to NREM -> waking) is represented by the broken arrow. NREM  =  non-REM sleep, REM  =  rapid eye movement sleep, SWA  =  Slow-Wave Anesthesia, NSWA  =  Non Slow-Wave Anesthesia, GABA  =  GABA-aminobutyric acid, ACh  =  acetylcholine, NE  =  norepinephrine, DA  =  dopamine.

References

    1. Courtin RF, Bickford RG, Faulconer A Jr (1950) The classification and significance of electro-encephalographic patterns produced by nitrous oxide-ether anesthesia during surgical operations. Proc Staff Meet Mayo Clin 25: 197–206. - PubMed
    1. Kiersey DK, Bickford RG, Faulconer A Jr (1951) Electro-encephalographic patterns produced by thiopental sodium during surgical operations; description and classification. Br J Anaesth 23: 141–152. - PubMed
    1. Clark DL, Rosner BS (1973) Neurophysiologic effects of general anesthetics. I. The electroencephalogram and sensory evoked responses in man. Anesthesiology 38: 564–582. - PubMed
    1. Dement W, Kleitman N (1957) Cyclic variations in EEG during sleep and their relation to eye movements, body motility, and dreaming. Electroencephalogr Clin Neurophysiol 9: 673–690. - PubMed
    1. Rechtschaffen A, Kales A (1968) A manual of standardized terminology, techniques, and scoring system for sleep stages of human subjects. University of California, Los Angeles: Brain Information Service/Brain Research Institute. - PubMed

Publication types