. 2014 Dec;281(23):5325-40.
doi: 10.1111/febs.13073. Epub 2014 Oct 25.

Distinct conformational behaviors of four mammalian dual-flavin reductases (cytochrome P450 reductase, methionine synthase reductase, neuronal nitric oxide synthase, endothelial nitric oxide synthase) determine their unique catalytic profiles

Affiliations

Distinct conformational behaviors of four mammalian dual-flavin reductases (cytochrome P450 reductase, methionine synthase reductase, neuronal nitric oxide synthase, endothelial nitric oxide synthase) determine their unique catalytic profiles

Mohammad M Haque et al. FEBS J. 2014 Dec.

Abstract

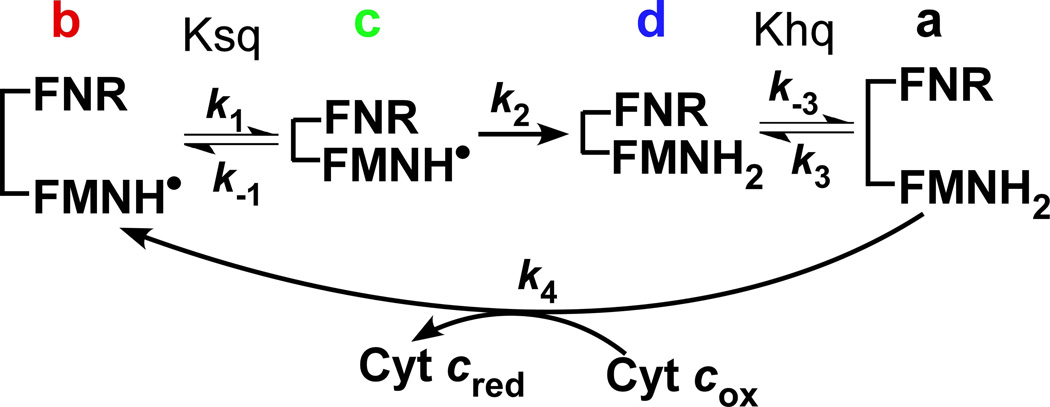
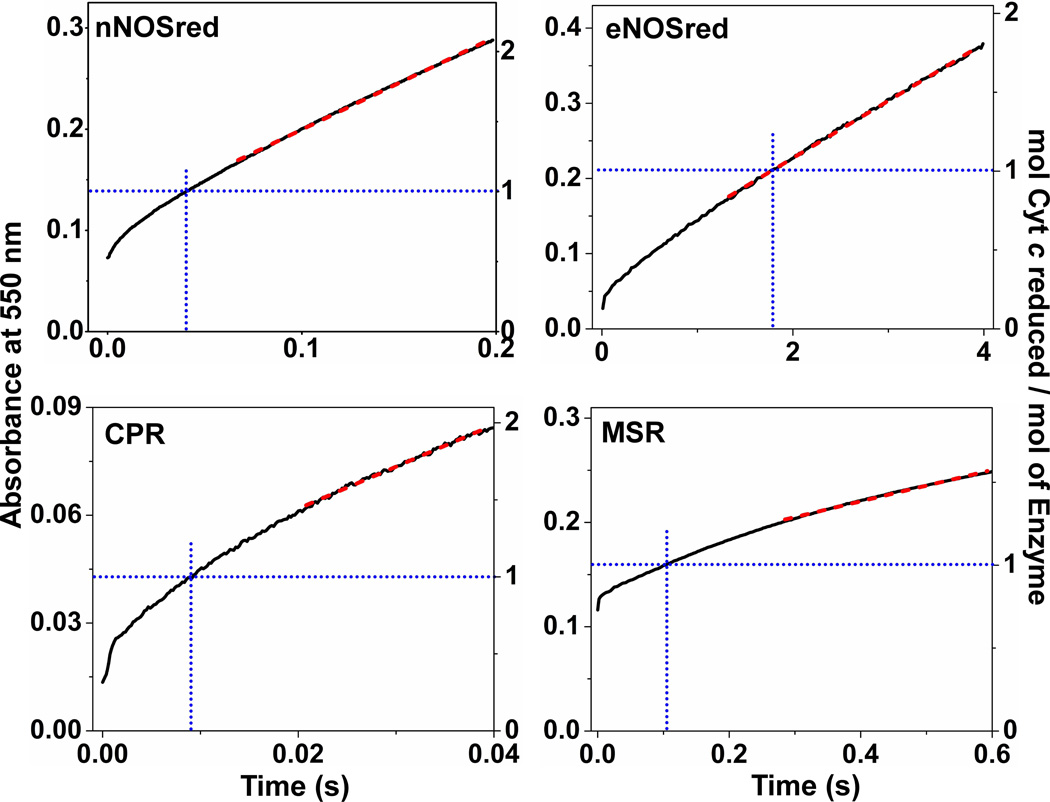
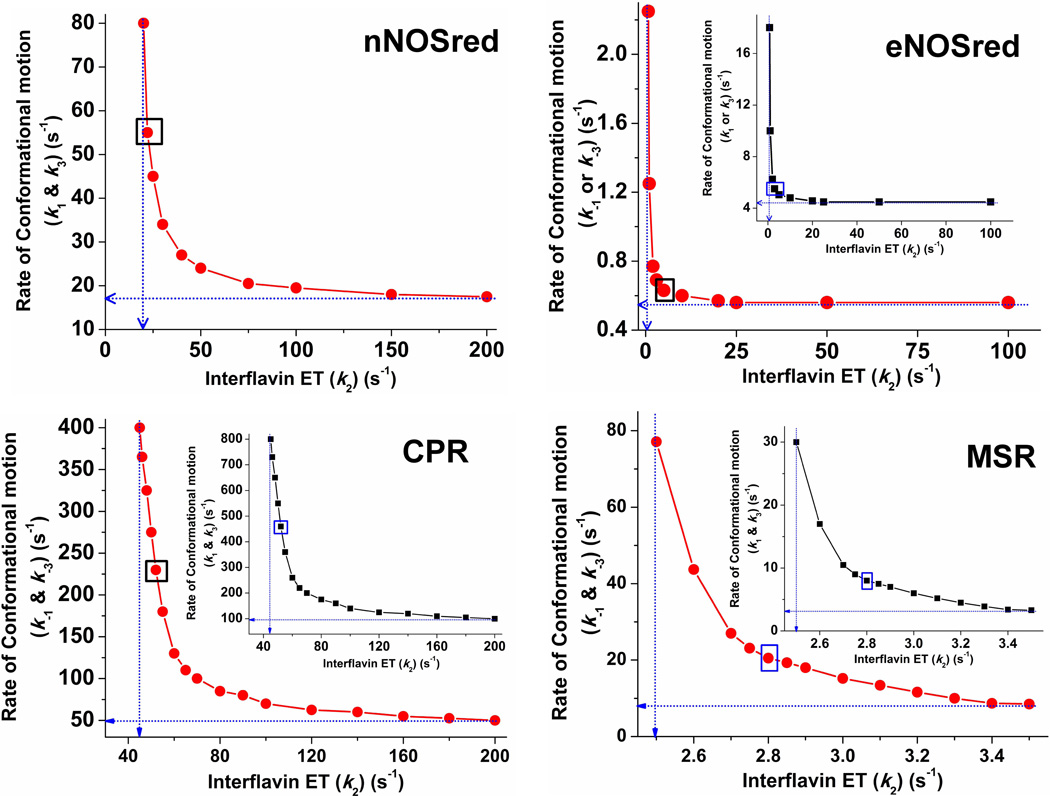
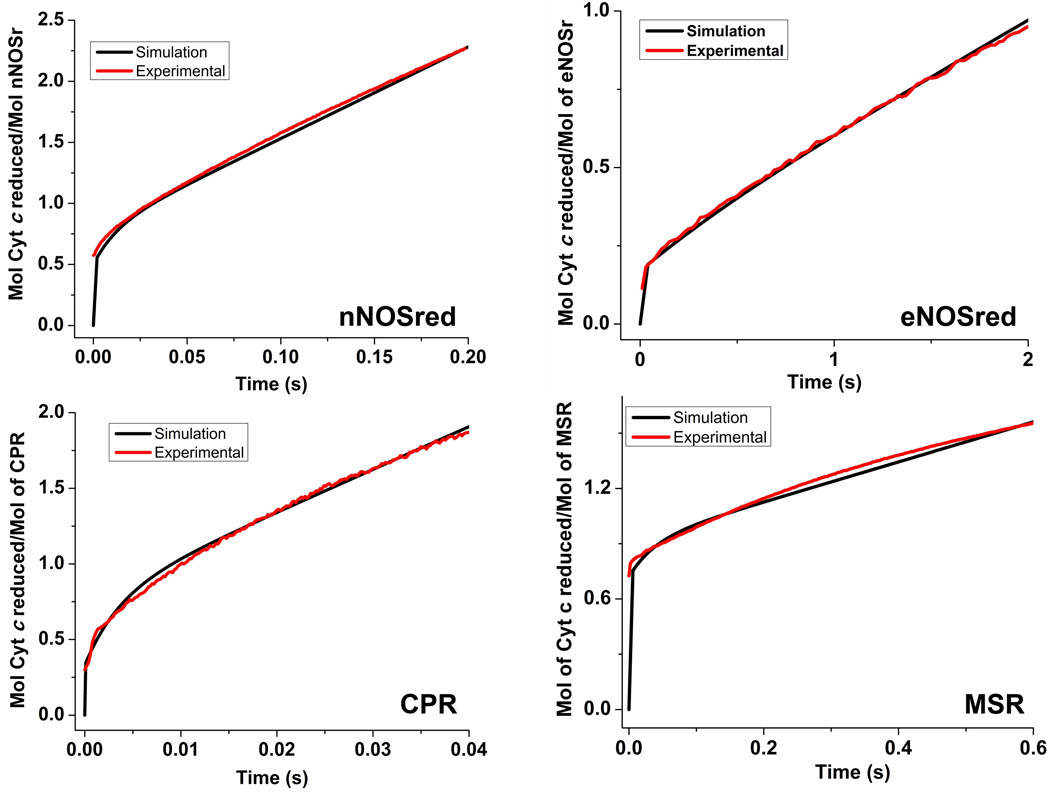
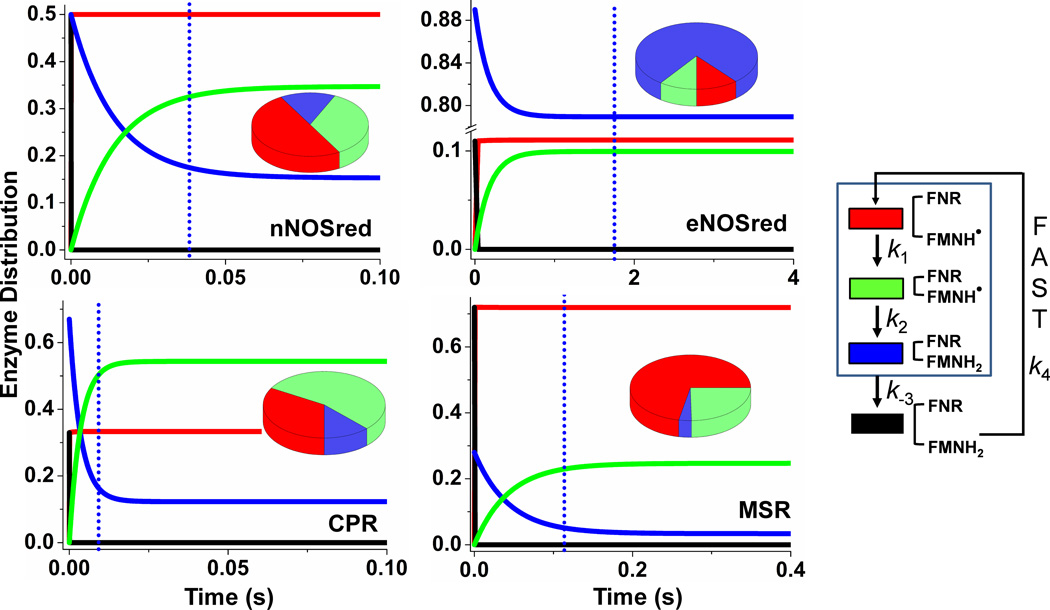
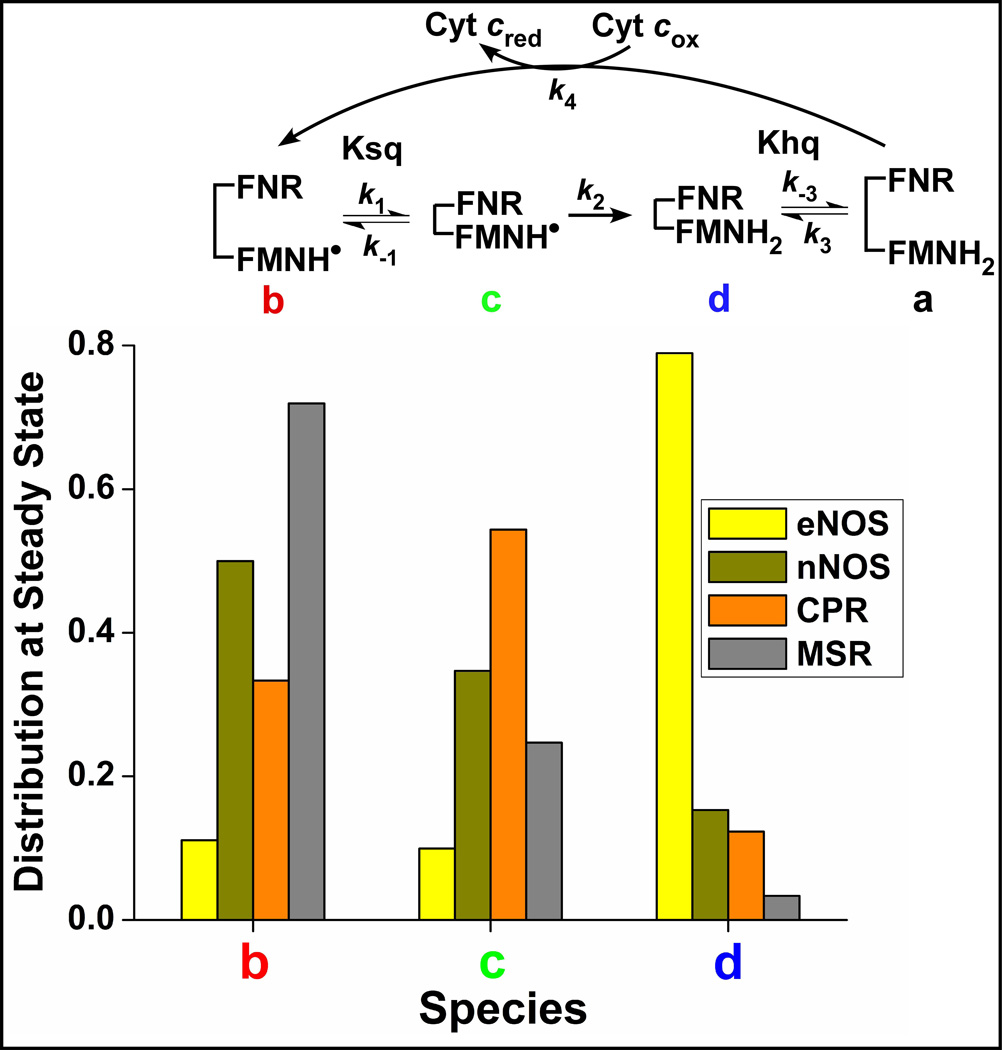
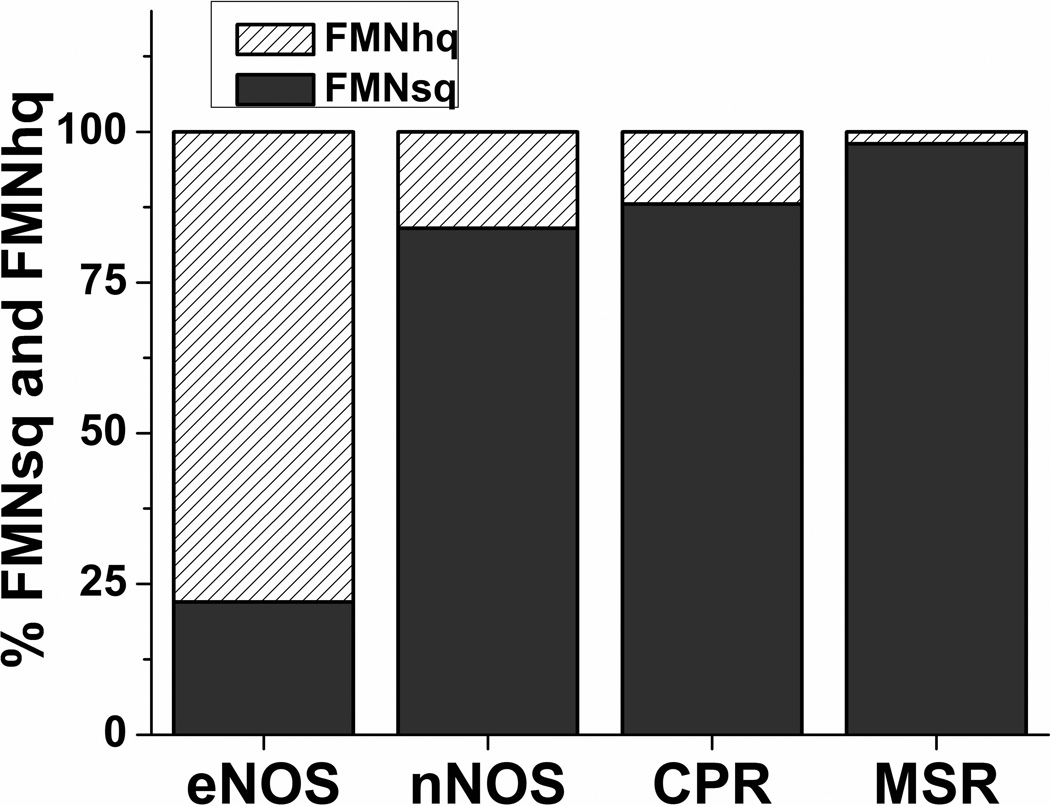
Multidomain enzymes often rely on large conformational motions to function. However, the conformational setpoints, rates of domain motions and relationships between these parameters and catalytic activity are not well understood. To address this, we determined and compared the conformational setpoints and the rates of conformational switching between closed unreactive and open reactive states in four mammalian diflavin NADPH oxidoreductases that catalyze important biological electron transfer reactions: cytochrome P450 reductase, methionine synthase reductase and endothelial and neuronal nitric oxide synthase. We used stopped-flow spectroscopy, single turnover methods and a kinetic model that relates electron flux through each enzyme to its conformational setpoint and its rates of conformational switching. The results show that the four flavoproteins, when fully-reduced, have a broad range of conformational setpoints (from 12% to 72% open state) and also vary 100-fold with respect to their rates of conformational switching between unreactive closed and reactive open states (cytochrome P450 reductase > neuronal nitric oxide synthase > methionine synthase reductase > endothelial nitric oxide synthase). Furthermore, simulations of the kinetic model could explain how each flavoprotein can support its given rate of electron flux (cytochrome c reductase activity) based on its unique conformational setpoint and switching rates. The present study is the first to quantify these conformational parameters among the diflavin enzymes and suggests how the parameters might be manipulated to speed or slow biological electron flux.

Keywords: conformational equilibrium; electron transfer; flavoprotein; kinetic model; nitric oxide.


Figures

Figure 1
Figure 1. Kinetic model for electron flux through a dual-flavin enzyme
The model uses four kinetic rates: association (k1 or k3) and dissociation (k−1 or k−3) of the FMN and FNR domains; the FMNH• reduction rate (k2), and the cytochrome c reduction rate (k4). The fully-reduced enzyme in the open conformation (species a) reduces cytochrome c and generates species b, which then undergoes successive conformational closing, interflavin electron transfer, and conformational opening steps to complete the cycle.
Figure 2
Figure 2. Reaction of fully reduced flavoproteins with excess cytochrome c
Solutions of pre-reduced proteins (~10–12 µM) containing 200 µM NADPH were rapidly mixed with excess cytochrome c (100 µM) in a stopped-flow instrument under anaerobic conditions at 10 °C. Kinetic traces were recorded at 550 nm during the first few electron transfers to cytochrome c. This was done for nNOSred, eNOSred, CPR, and MSR. The absorbance change representing the first turnover is shown by blue dotted lines according to the right-hand scale in each figure. To calculate slope, tangent lines drawn onto the near-linear portions of the stopped-flow traces (indicated as red dashed lines) in each panel. Data are representative of at least two experiments.
Figure 3
Figure 3. Conformational motion and interflavin electron transfer rate settings that support observed electron flux through dual-flavin enzymes
Data were obtained from simulations of the kinetic model in Fig. 1. For a given k2 value, rates of conformational motion were screened for a value that yielded the observed electron flux. For all panels, blue dotted lines indicate the lower boundary values for the rates of conformational motion (Y-intercept) and interflavin electron transfer (X-intercept). For eNOSred, CPR, and MSR, the main panel shows the resulting values in terms of the conformational opening rates (k−1 = k−3). In the inset, the same data points are plotted, this time indicating the rates of conformational closing (k1 = k3) on the y axis. The boxed points in each panel indicate the best-fit rate pairs. For nNOSred, rates of conformational motion were screened for a given k2 value that yielded an electron flux of ~8 s−1 when Keq =1 and k1 = k−1 = k3 = k−3. In eNOSred conformational motion rates were set so that Khq = Ksq = 0.125 and the electron flux equaled 0.49 s−1. For CPR to achieve an electron flux of 28 s−1 and a Keq of 0.5, a number of k2 values were simulated in combination with different conformational motion rates. For MSR, rates of conformational motion were screened for a corresponding k2 value that yielded an electron flux of 0.7 s−1, while Khq = Ksq = 2.6, k1 = k3, and k−1 = k−3.
Figure 4
Figure 4. Simulated reactions of fully-reduced dual-flavin enzymes with excess cytochrome c
The traces were obtained by simulating the kinetic model in Fig. 1, using different rates of conformational motion and interflavin electron transfer (k2) to match experimental traces for each of the four dual-flavins under study. Total protein concentration is 1.0, and the concentration of enzyme species d + a was set equal to 1.0 at time = 0 in the simulations. For nNOSred, conformational motion rates were set so that Khq = Ksq = 1, and k1 = k−1 = k3 = k−3. With these parameters, the closest match to the experimental traces in Fig. 2 was found when k1 = k−1 = k3 = k−3= 53, and k2 = 22. For eNOSred, conformational motion rates were set so that Khq = Ksq = 0.125, k1 = k3, and k−1 = k−3 = 0.125×k1. The best fit of experimental traces was found when the kinetic settings (s−1) were k1 = k3 = 5.0, k−1 = k−3 = 0.63, k2 = 5.0. In case of CPR the conformational motion rates were set so that Khq = Ksq = 0.5, k1 = k3, and k−1 = k−3 = 0.5×k1. The best fit was found when the kinetic settings (s−1) were k1 = k3 = 460, k−1= k−3 = 230, k2 = 52. For MSR, conformational motion rates were Khq = Ksq = 2.57 and k1 = k3;k−1 = k−3 = 2.57×k1. The best fit was found when the kinetic settings (s−1) were k1 = k3 = 8, k−1= k−3 = 20.5, k2= 2.8. Simulated traces (black lines) are overlayed with experimental traces (red lines).
Figure 5
Figure 5. Patterns of enzyme distribution versus reaction time in dual-flavin enzymes
Rate pairs of conformational motion and interflavin electron transfer (obtained from the simulated best-fit values (Fig. 4)) were used in each case to simulate and achieve experimentally obtained cytochrome c reduction rates. Lines indicate the relative concentrations of each enzyme species a-d (see Fig. 1), with the total enzyme concentration being 1.0 and the concentration of enzyme species d + a set equal to 1.0 at time = 0 in the simulations. The blue dotted line in each panel marks the time required for the enzyme to reduce one equivalent of cytochrome c. Kinetic settings were: For nNOSred: k1 = k−1= k3 = k−3 = 53, k2 = 22; For eNOSred: k1 = k−3 = 5.0, k−1 = k3 = 0.63, k2 = 5; For CPR: k1 = k3 = 460, k−1 = k−3 = 230, k2 = 52; For MSR k1 = k3 = 8, k−1 = k−3 = 20.5, k2 = 2.8. Pie graphs in each panel are showing different species distributed at steady-state. Color scheme for different species are as follows: species a: black, species b: red, species c: green, and species d: blue.
Figure 6
Figure 6. The steady-state distributions of different species among the four flavoproteins
Buildup of different species at steady-state. Buildup of the conformationally open FMNhq species (species a) is essentially nil in all enzymes because it reacts so quickly with the excess cytochrome c.
Figure 7
Figure 7
Percentage proportion of FMNsq versus FMNhq present in each enzyme during its steady-state reaction with cytochrome c.
Figure 8
Figure 8. Crystal Structures and structure based models of flavoproteins
We used 1AMO for rat cytochrome P450 reductase and 1TLL for rat nNOS. The available structure of rat nNOS (1TLL) was used as template for the bovine eNOS model. We built two different models for methionine synthase reductase using either nNOS (1TLL) or cytochrome P450 reductase (1AMO) structures as templates. Upper panels are side view and Lower panels are top view of structure. FNR domain is shown in blue, FMN domain is shown in green; FAD (yellow) and FMN (orange) are shown as sticks.

References

    1. Aigrain L, Fatemi F, Frances O, Lescop E, Truan G. Dynamic control of electron transfers in diflavin reductases. Int. J. Mol. Sci. 2012;13:15012–15041. - PMC - PubMed
    1. De CL, Mattevi A. New frontiers in structural flavoenzymology. Curr. Opin. Struct. Biol. 2006;16:722–728. - PubMed
    1. Iyanagi T. Structure and function of NADPH-cytochrome P450 reductase and nitric oxide synthase reductase domain. Biochem. Biophys. Res. Commun. 2005;338:520–528. - PubMed
    1. Joosten V, van Berkel WJ. Flavoenzymes. Curr. Opin. Chem. Biol. 2007;11:195–202. - PubMed
    1. Gomez-Moreno C. New roles of flavoproteins in molecular cell biology. FEBS J. 2009;276:4289. - PubMed

Publication types

MeSH terms