. 2014 Sep 29;9(9):e108431.
doi: 10.1371/journal.pone.0108431. eCollection 2014.

Systems responses to progressive water stress in durum wheat

Affiliations

Systems responses to progressive water stress in durum wheat

Dimah Z Habash et al. PLoS One. .

Abstract

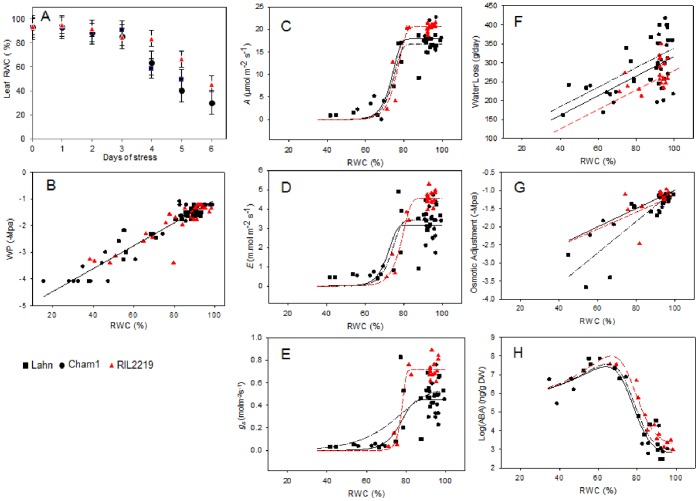
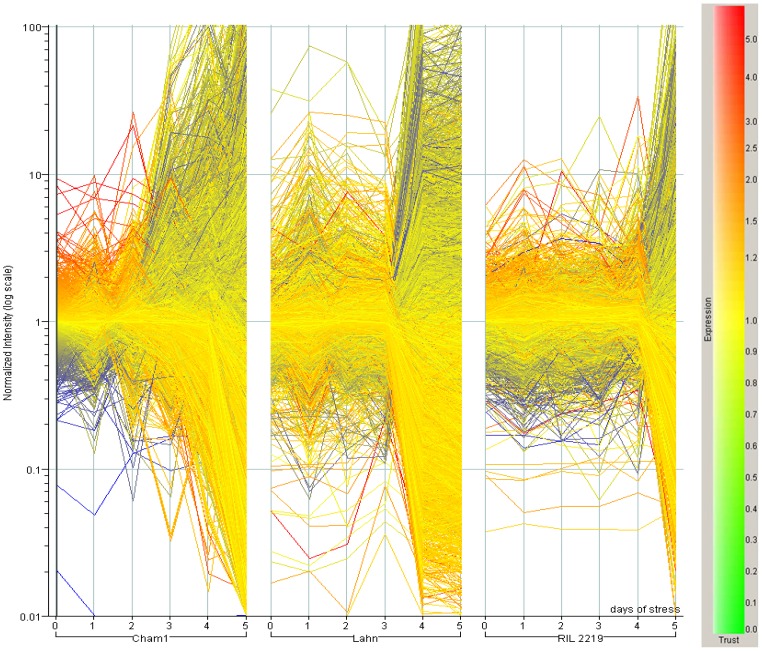
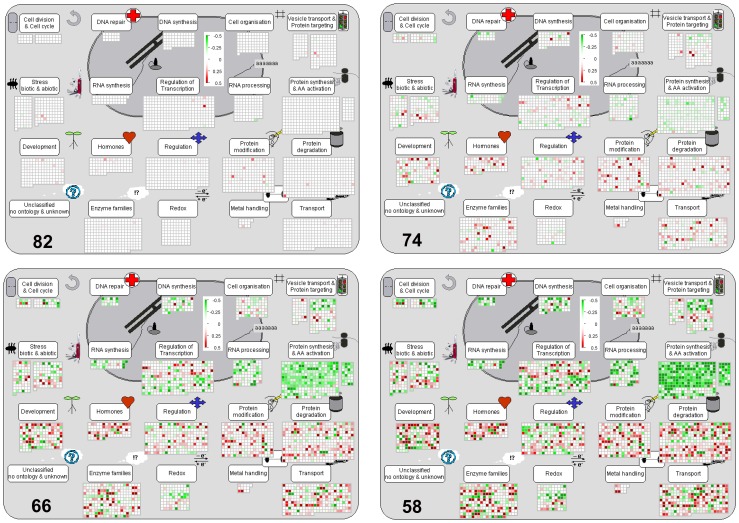
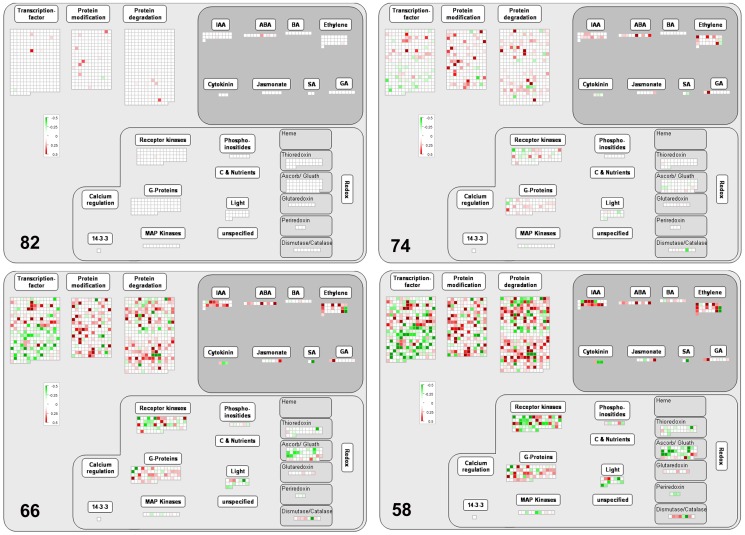
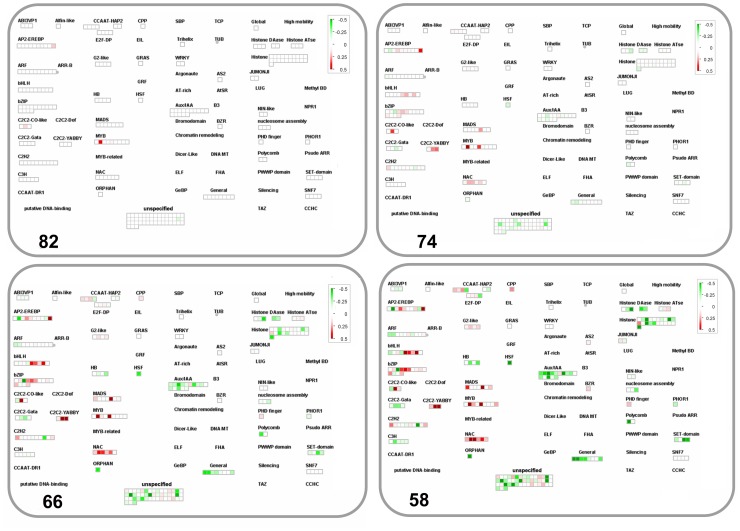
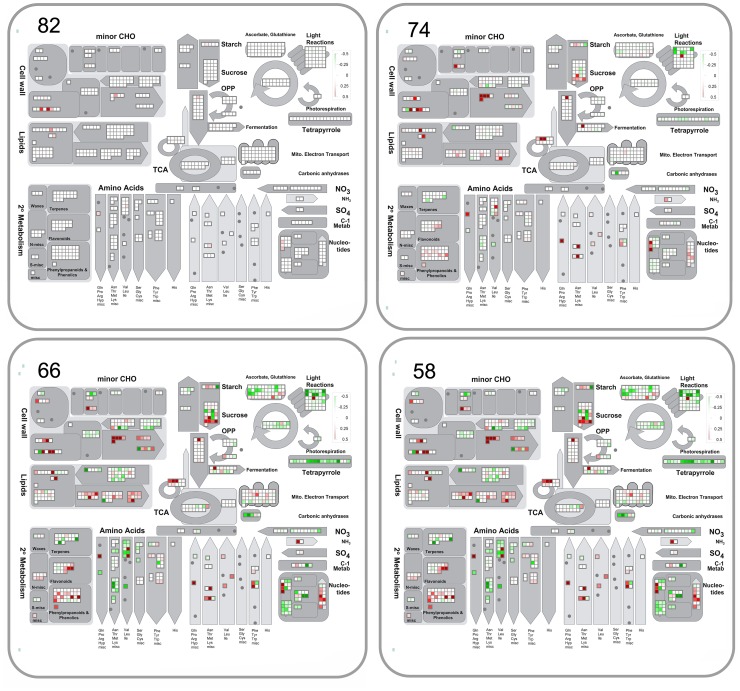
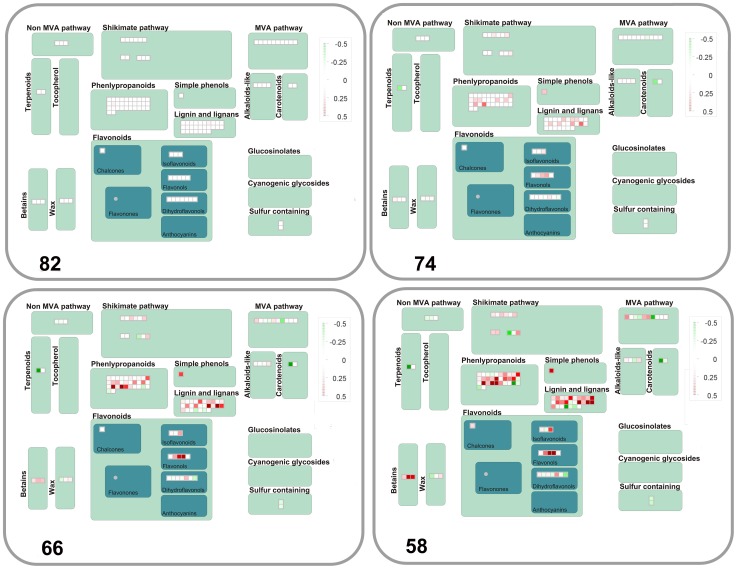
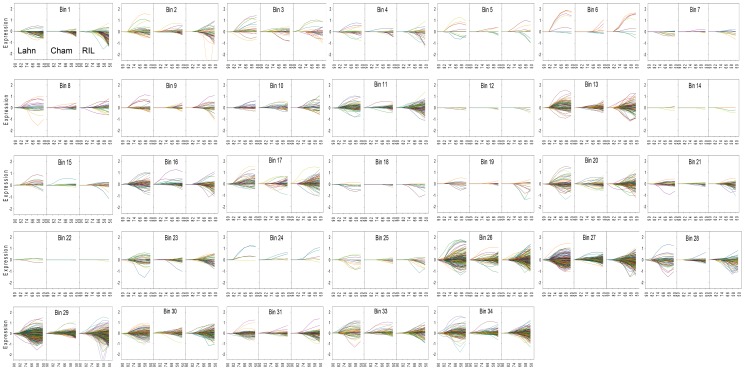
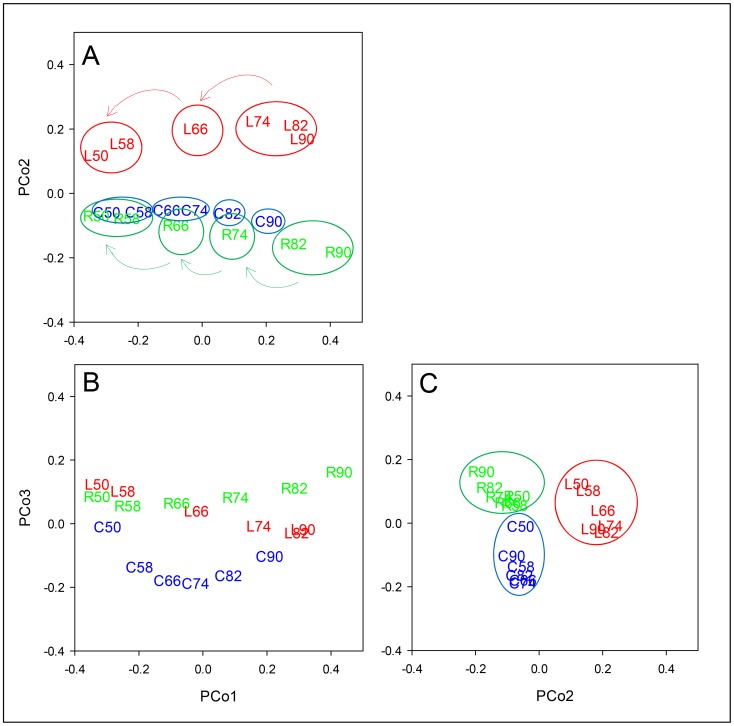
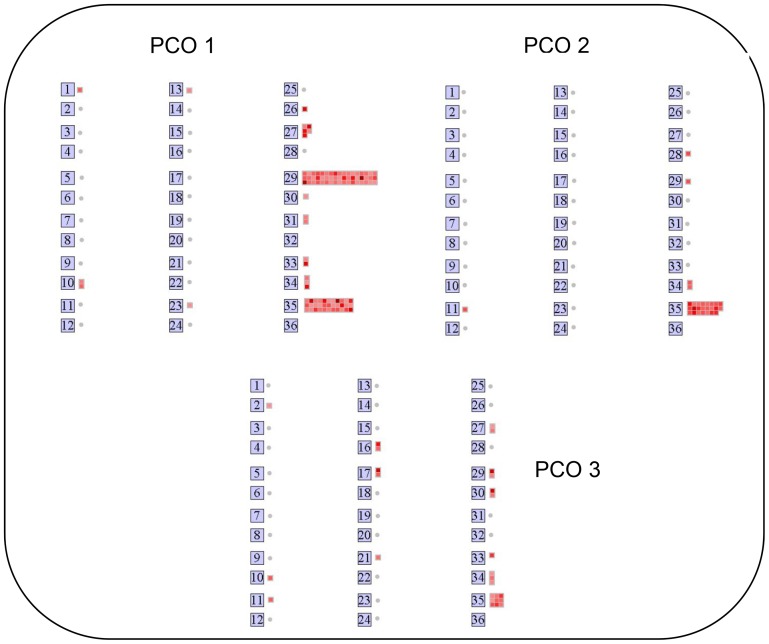
Durum wheat is susceptible to terminal drought which can greatly decrease grain yield. Breeding to improve crop yield is hampered by inadequate knowledge of how the physiological and metabolic changes caused by drought are related to gene expression. To gain better insight into mechanisms defining resistance to water stress we studied the physiological and transcriptome responses of three durum breeding lines varying for yield stability under drought. Parents of a mapping population (Lahn x Cham1) and a recombinant inbred line (RIL2219) showed lowered flag leaf relative water content, water potential and photosynthesis when subjected to controlled water stress time transient experiments over a six-day period. RIL2219 lost less water and showed constitutively higher stomatal conductance, photosynthesis, transpiration, abscisic acid content and enhanced osmotic adjustment at equivalent leaf water compared to parents, thus defining a physiological strategy for high yield stability under water stress. Parallel analysis of the flag leaf transcriptome under stress uncovered global trends of early changes in regulatory pathways, reconfiguration of primary and secondary metabolism and lowered expression of transcripts in photosynthesis in all three lines. Differences in the number of genes, magnitude and profile of their expression response were also established amongst the lines with a high number belonging to regulatory pathways. In addition, we documented a large number of genes showing constitutive differences in leaf transcript expression between the genotypes at control non-stress conditions. Principal Coordinates Analysis uncovered a high level of structure in the transcriptome response to water stress in each wheat line suggesting genome-wide co-ordination of transcription. Utilising a systems-based approach of analysing the integrated wheat's response to water stress, in terms of biological robustness theory, the findings suggest that each durum line transcriptome responded to water stress in a genome-specific manner which contributes to an overall different strategy of resistance to water stress.


Conflict of interest statement

Competing Interests: The authors have declared that no competing interests exist.

Figures

Figure 1
Figure 1. Physiological and biochemical parameters of leaves during water deficit.
Plant water status was measured by flag leaf %RWC as a function of days of stress (A), leaf water potential (B) and total plant water loss (F) during a stress transient of 0–6 days for three wheat lines Lahn (▪), Cham1 (•) and RIL2219 (▴). Leaf photosynthetic and biochemical parameters were CO2 assimilation (C), transpiration (D), stomatal conductance (E), osmotic adjustment (G) and ABA content (H). Linear regression analysis gave a single line relationship for leaf water potential, parallel lines (p<0.05, F-test) for water loss, and separate lines (p<0.05, F-test) for osmotic adjustment. Using the Gompertz curve, separate C and k parameters (p<0.05, F-tests) were required for CO2 assimilation, whereas for transpiration and stomatal conductance only separate C parameters (p<0.05, F-test) were required; (C–H) red line, black dashed line and black solid line are for RIL2219, Lahn and Cham1 respectively. For ABA, separate c parameters were significant (p<0.05, F-test) in the rational functions model.
Figure 2
Figure 2. Mean normalised expression of Affymetrix probesets from leaves exposed to water stress.
Filtered whole expression dataset of 19062 probes for the three wheat line leaves during the transient of six days of stress analysed using GenespringGX 8.0. Lines are coloured according to their normalised expression for genotype Cham1 at day 0.
Figure 3
Figure 3. Overview of cell function transcript expression during the water stress transient.
Transcript profile changes, at decreasing leaf %RWC (82,74,66,58), were similar across the stress transient for the three wheat lines in probes taken from MapMan bins 15,17,20,21,26,27,28,29,30,31,33,34 in the Line+Stress ANOVA group dataset (File S4). Results were visualised in MapMan and the colour scale for transcripts that were increased or decreased in abundance were denoted as red and green, respectively.
Figure 4
Figure 4. Expression of genes involved in regulatory pathways during water stress.
Response of transcripts annotated to MapMan bins 17, 21, 27, 29 and 30 at decreasing leaf %RWC during the water stress transient. ANOVA Dataset and visualisation as for Figure 3.
Figure 5
Figure 5. Changes in RNA regulation with focus on transcription during water stress.
Expression of probes annotated to transcription from MapMan bin 27 and 28 at decreasing leaf %RWC during the water stress transient. ANOVA Dataset and visualisation as for Figure 3.
Figure 6
Figure 6. Overview of transcription of genes annotated to primary metabolism during water stress.
Expression of probes from MapMan bins 1, 2, 3, 4, 5, 6, 7, 8, 9, 10, 11, 12, 13, 14, 16, 19, 21, 23 and 25, 30 at decreasing leaf %RWC during the water stress transient. ANOVA Dataset and visualisation as for Figure 3.
Figure 7
Figure 7. Changes in transcription of genes annotated to secondary metabolism during water stress.
Expression of probes annotated to MapMan bin 16 at decreasing leaf %RWC during the water stress transient. ANOVA Dataset and visualisation as for Figure 3.
Figure 8
Figure 8. Differences in the global transcription profiles of the three lines under stress.
Expression of probes from the three lines, Lahn, Cham1 and RIL2219, as a function of leaf %RWC during the water stress transient, visualised in MapMan for all metabolic bins. For every bin, the same colour probe is plotted for each wheat line to enable direct comparison. Transcript profiles belong to the Line × Stress ANOVA group dataset (File S5).
Figure 9
Figure 9. PCo plots for the expression of all 19062 probe dataset.
The first three PCos account for 72.8% of the variation represented in the (reduced) similarity matrix for the 18 wheat line by RWC combinations. Visualisation of the combinations in the three dimensions was achieved by plotting PCo1 vs. PCo2 (A), PCo1 vs. PCo3 (B) and PCo2 vs. PCo3 (C). Letters L, C and R represent the lines Lahn, Cham1 and RIL 2219 respectively at 90-50 leaf %RWC values. Arrows on plot A show the direction of the stress transient of decreasing leaf RWC and the free-drawn circles around the points highlight potential functional states for each line, inferred from distance between points.
Figure 10
Figure 10. MapMan visualisation of the top PCo probes responsible for differences.
5% of probes with greatest F-values following PCO (data from File S7) showed differences in distribution across all metabolic bins for PCo1, PCo2, and PCo3. For presentation in Mapman, FPCO maximum values were set at 2000, 700 and 450 for PCo1, PCo2, and PCo3 respectively.

References

    1. Nachit MM, Nachit G, Ketata H, Gauch HG, Zobel RW (1992) Use of AMMI and linear regression models to analyze genotype-byenvironment interaction in durum wheat. Theor. Appl. Genet 83: 597–601. - PubMed
    1. Araus JL, Slafer GA, Reynolds MP, Royo C (2002) Plant breeding and drought in C3 cereals: what should we breed for? Ann. Bot. 89, Special No, 925–940. - PMC - PubMed
    1. Stocker TF, Qin D, Plattner GK, Alexander LV, Allen SK, et al.. (2013) Technical Summary. In: Stocker TF, Qin D, Plattner GK, Tignor M, Allen SK, Boschung J, Nauels A, Xia Y, Bex V and Midgley PM, editors. Climate Change 2013: The Physical Science Basis. Contribution of Working Group I to the Fifth Assessment Report of the Intergovernmental Panel on Climate Change Cambridge University Press, Cambridge, United Kingdom and New York, NY, USA.
    1. Bates BC, Kundzewicz ZW, Wu S, Palutikof JP, Eds. (2008) Climate change and water. Technical Paper of the Intergovernmental Panel on Climate Change. IPCC Secretariat, Geneva.
    1. Hoerling M, Eischeid J, Perlwitz J, Quan X, Zhang T, et al. (2012) On the Increased Frequency of Mediterranean Drought. J Clim 25: 2146–2161.

Publication types