. 2015 Mar;61(3):979-89.
doi: 10.1002/hep.27539. Epub 2015 Jan 30.

Dysregulated serum response factor triggers formation of hepatocellular carcinoma

Affiliations

Dysregulated serum response factor triggers formation of hepatocellular carcinoma

Stefan Ohrnberger et al. Hepatology. 2015 Mar.

Erratum in

  • Hepatology. 2015 May;61(5):1772. Authenrieth, Stella E [corrected to Autenrieth, Stella E]

Abstract

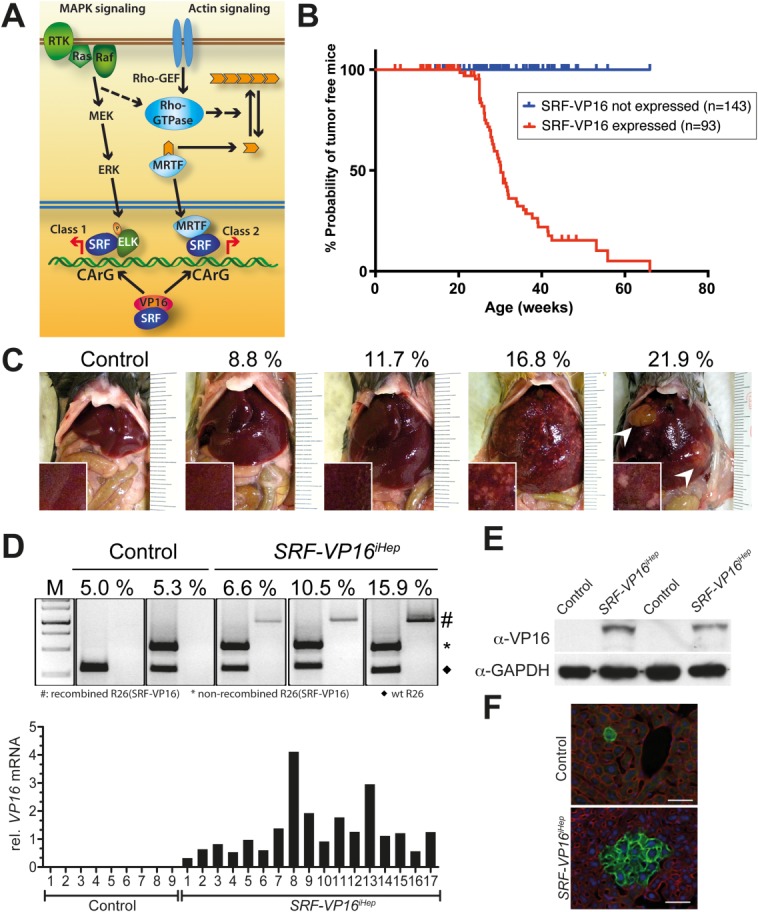
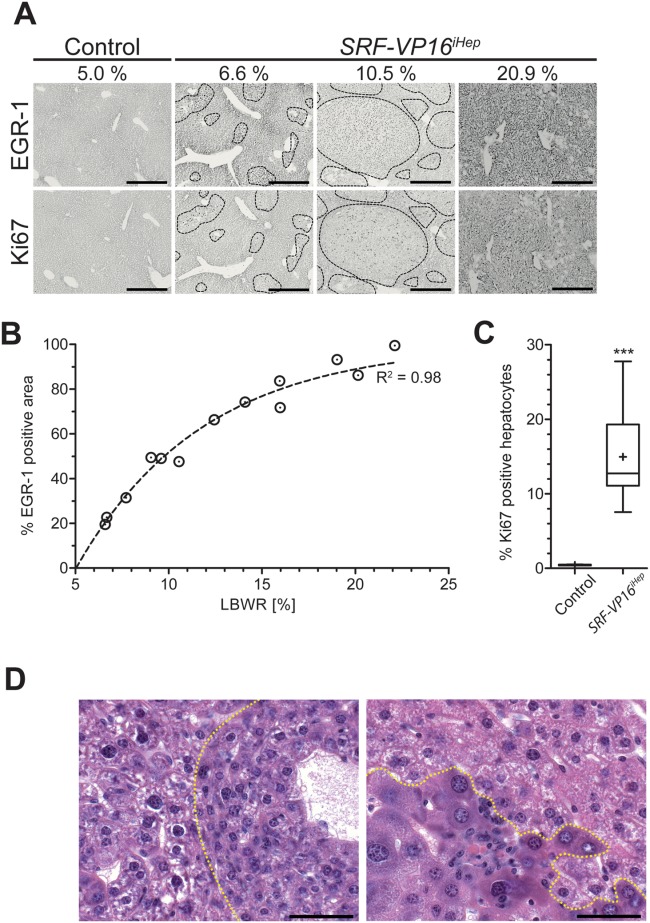
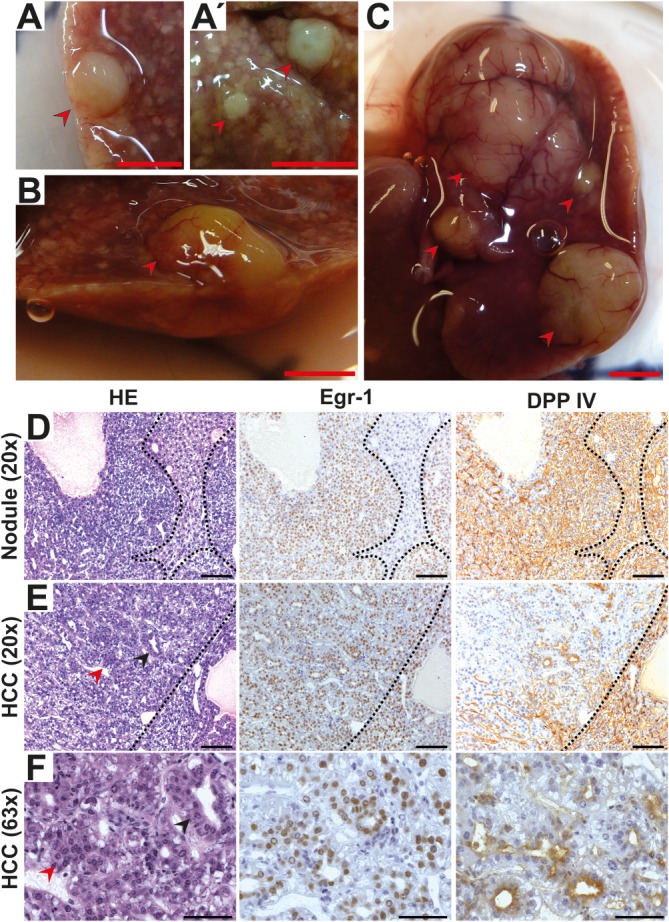
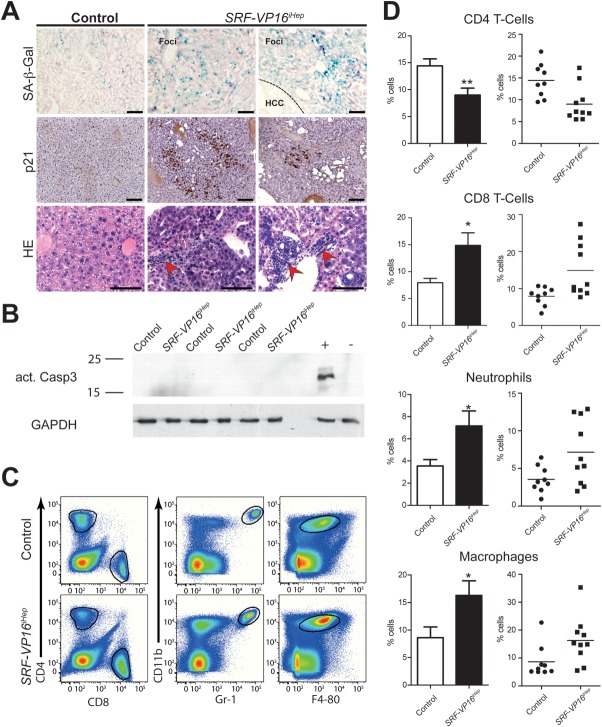
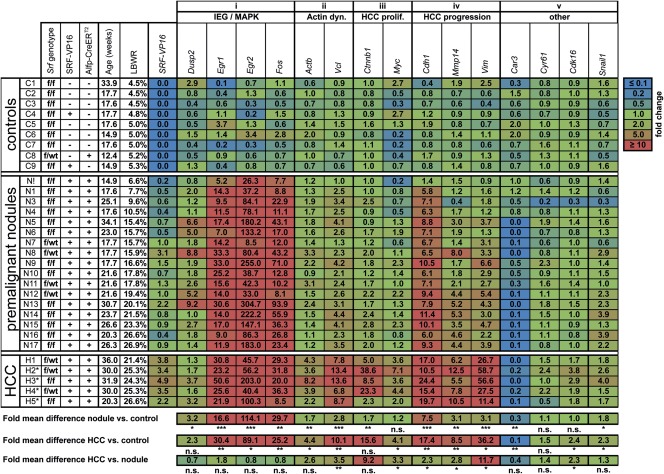
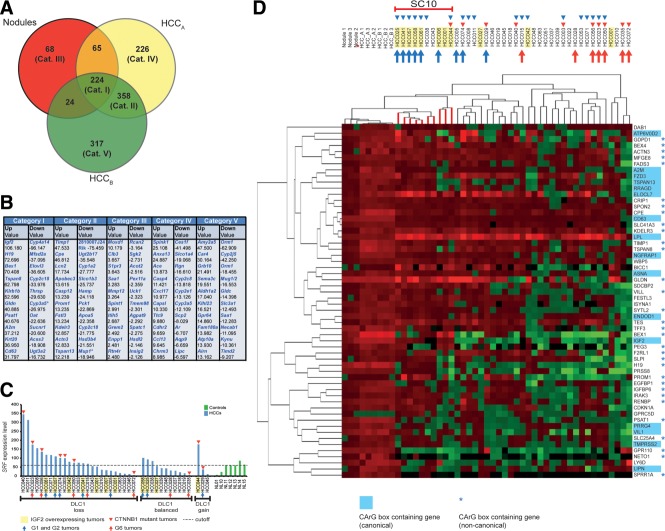
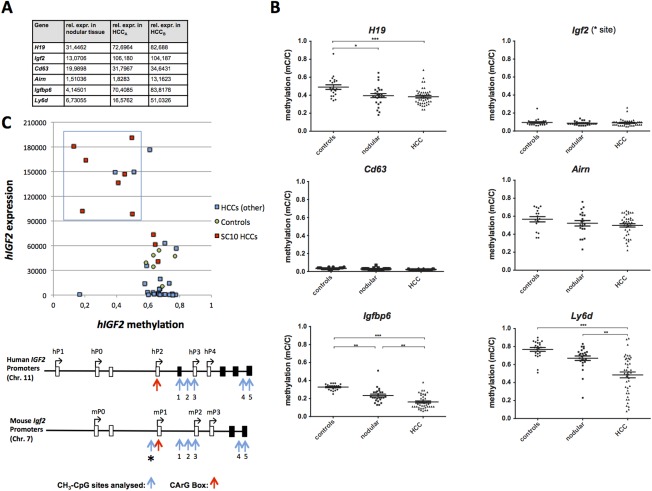
The ubiquitously expressed transcriptional regulator serum response factor (SRF) is controlled by both Ras/MAPK (mitogen-activated protein kinase) and Rho/actin signaling pathways, which are frequently activated in hepatocellular carcinoma (HCC). We generated SRF-VP16iHep mice, which conditionally express constitutively active SRF-VP16 in hepatocytes, thereby controlling subsets of both Ras/MAPK- and Rho/actin-stimulated target genes. All SRF-VP16iHep mice develop hyperproliferative liver nodules that progresses to lethal HCC. Some murine (m)HCCs acquire Ctnnb1 mutations equivalent to those in human (h)HCC. The resulting transcript signatures mirror those of a distinct subgroup of hHCCs, with shared activation of oncofetal genes including Igf2, correlating with CpG hypomethylation at the imprinted Igf2/H19 locus.

Conclusion: SRF-VP16iHep mHCC reveal convergent Ras/MAPK and Rho/actin signaling as a highly oncogenic driver mechanism for hepatocarcinogenesis. This suggests simultaneous inhibition of Ras/MAPK and Rho/actin signaling as a treatment strategy in hHCC therapy.


Figures

Figure 1
Figure 1
Murine hepatocyte-specific expression of SRF-VP16 leads to hepatocarcinogenesis. (A) Ras/MAPK and Rho/actin signaling target the SRF-cofactor module. Constitutively active SRF-VP16 acts independent of upstream signaling. (B) Kaplan-Meier survival curves of Alfp-CreERT2 mice, expressing (red) SRF-VP16 or not (blue). (C) SRF-VP16iHep livers show increasing numbers and sizes of premalignant nodules, as well as HCCs (arrowheads), correlating with increasing LBWR (%). (D) Rosa26(SRF-VP16) genomic PCR identifies Cre recombination-mediated loss of the STOP-flox cassette (upper). SRF-VP16 RNA expression: qRT-PCR (17 liver samples, increasing LBWR) (lower). (E) Western blotting identifying SRF-VP16 protein. (F) mT/mG-Cre indicator mice reveal spontaneous activation of Alfp-CreERT2 in livers of both control (upper) and SRF-VP16iHep (lower) mice (10 weeks old), the latter displaying proliferative cell expansion (scale bars = 50 μm).
Figure 2
Figure 2
SRF-VP16 drives hepatocyte hyperproliferation and premalignant nodule formation. (A) Increasing LBWR (%) correlates with expanding premalignant nodules of Egr1-positive (upper) and Ki67-positive (lower) hyperproliferative hepatocytes. Scale bar = 500 μm. (B) Increasing LBWR correlates with sizes (EGR1-positive area) of hyperproliferative nodules (one-phase association: R2 = 0.977). (C) Quantitation of Ki67-positive hepatocyte nuclei in control (0.4 ± 0.03%) versus SRF-VP16iHep animals (7.5 to 27.5%; mean 15% ± 3%) (n = 11). (D) Hematoxylin and eosin (H&E) staining of SRF-VP16iHep livers with LBWR of 7.3% (left) and 10.8% (right). Hyperproliferative nodules display small-cell dysplasia of SRF-VP16 expressing hepatocytes (left panel, right of dotted line). Later stages show severe nuclear atypia, focal inflammatory cell infiltration, and single-cell invasion into the nonneoplastic tissue (right panel, below dotted line). Scale bar = 50 μm.
Figure 3
Figure 3
Malignant transformation to HCC. HCCs of small (0.2-0.5 cm) (A,A′), intermediate (B), or large (>2.5 cm) (C) size. Scale bar = 1 cm. Histology of livers containing premalignant nodules (D) or mHCC tissue (E,F). Scale bars = (D,E) 100 μm, (F) 50 μm. Hyperproliferative nodules are composed of small, basophilic hepatocytes showing a microtrabecular growth (D, left), express the SRF target gene Egr1 (D, middle), and the polarization marker DPP IV (D, right). HCC tissue characterized by nuclear and architectural atypia in the form of pseudoglandular (black arrowhead) and irregular solid-trabecular growth patterns (red arrowhead) (E, left; F, left). Nuclear Egr1 expression is high throughout the tumor (E, middle; F, middle), residual DPP IV expression is restricted to luminal membranes of pseudoglands (E, right; F, right).
Figure 4
Figure 4
Premalignant nodules harbor senescent hepatocytes and infiltrating lymphocytes. (A) Senescent hepatocytes in premalignant nodules of SRF-VP16iHep mice express SA-β-galactosidase (upper) and p21 (middle), and display foci of infiltrating immune cells (red arrowheads, lower). No β-bal signal is seen in HCC (upper, right). Scale bar = 100 μm. (B) Western blotting of activated Caspase 3, including positive (+) and negative (–) protein controls. (C,D) Immunophenotyping (flow cytometry) identifies neutrophil (CD11bhighGr-1+) infiltration into nodular livers, macrophages (CD11b+F4/80+), and CD8+ T cells, while CD4+ T cells are decreased. *P < 0.05 and **P < 0.01. Values represent mean ± SEM.
Figure 5
Figure 5
SRF-VP16iHep liver tissues display altered gene expression profiles. Expression of candidate genes in liver tissue of control mice (C1-C9), and premalignant nodular tissue (F1-F17) and mHCCs (H1-H5) of SRF-VP16iHep mice. Genotype abbreviations: f, Srf-flex1; wt, wild-type; SRF-VP16 +, positive; SRF-VP16 –, negative; Alfp-CreERT2 +, positive; Alfp-CreERT2 –, negative). Functional grouping of candidate genes and relative expression levels (q-RT-PCR) (numerical and by heat-map coloring) is indicated. Tissue samples are arranged by increasing LBWR (%), tumors by size (H1 and H2: 1.0 cm, H3: 2.0 cm, H3-H5: 2.5 cm).
Figure 6
Figure 6
SRF-VP16-triggered mHCCs share expression profiles with G1/G2 subgroups of hHCCs. (A) Venn diagram depicting differentially expressed transcripts in all three types of tissue (Category I), mHCCs (Category II), nodular tissue (Category III), mHCCs without Ctnnb1 mutation (HCCA; Category IV), and mHCCs with Ctnnb1 mutation (HCCB; Category V). (B) Listing of 10 most strongly up- or down-regulated transcripts per category (x-fold differential expression). (C) Cohort of 40 hHCCs grouped according to genomic DLC1 status (X-axis) and SRF mRNA expression levels (Y-axis). IGF2 RNA overexpression status (yellow box), CTNNB1 mutation status (red triangle), Boyault class (G1 and G2, blue arrow; G6, red arrow). (D) Combined unsupervised hierarchical clustering of the 58 most strongly up-regulated transcripts in SRF-VP16-triggered nodular/mHCC tissue against 40-membered hHCC cohort (blue triangles: SRF overexpressing tumors, other symbols as in (C)). The "subcluster of 10" hHCCs (SC10) cluster close to the mHCCs. Murine genes contain a canonical (blue box) or noncanonical CArG-box (blue asterisks).
Figure 7
Figure 7
Genomic methylation profiles of selected sites in murine and human HCCs. (A) Selected transcript expression in SRF-VP16iHep mice. (B) Genomic CpG methylation ratios (mC/C) at the indicated gene loci of murine tissues. H19 locus investigated at imprinting control region (Igf2/H19 DMR), other genes investigated at promoter. (C) 40-membered hHCC cohort: averaged methylation ratio of CpG sites 1-3 of human IGF2 hP3 promoter blotted versus corresponding hIGF2 mRNA expression levels. Boxed: hHCC subgroup with reduced CpG methylation and concomitantly elevated IGF2 expression. Lower: 5′ regions of the human IGF2 gene (hP0 to hP4 promoters) and the murine Igf2 gene (mP0 to mP3 promoters).

References

    1. Jemal A, Bray F, Center MM, Ferlay J, Ward E, Forman D. Global cancer statistics. CA Cancer J Clin. 2011;61:69–90. - PubMed
    1. Boyault S, Rickman DS, de Reynies A, Balabaud C, Rebouissou S, Jeannot E, et al. Transcriptome classification of HCC is related to gene alterations and to new therapeutic targets. Hepatology. 2007;45:42–52. - PubMed
    1. Guichard C, Amaddeo G, Imbeaud S, Ladeiro Y, Pelletier L, Maad IB, et al. Integrated analysis of somatic mutations and focal copy-number changes identifies key genes and pathways in hepatocellular carcinoma. Nat Genet. 2012;44:694–698. - PMC - PubMed
    1. Hoshida Y, Nijman SM, Kobayashi M, Chan JA, Brunet JP, Chiang DY, et al. Integrative transcriptome analysis reveals common molecular subclasses of human hepatocellular carcinoma. Cancer Res. 2009;69:7385–7392. - PMC - PubMed
    1. Calvisi DF, Ladu S, Gorden A, Farina M, Conner EA, Lee JS, et al. Ubiquitous activation of Ras and Jak/Stat pathways in human HCC. Gastroenterology. 2006;130:1117–1128. - PubMed

Publication types

LinkOut - more resources