. 2014 Dec;34(24):4420-35.
doi: 10.1128/MCB.01089-14. Epub 2014 Sep 29.

Coregulated expression of the Na+/phosphate Pho89 transporter and Ena1 Na+-ATPase allows their functional coupling under high-pH stress

Affiliations

Coregulated expression of the Na+/phosphate Pho89 transporter and Ena1 Na+-ATPase allows their functional coupling under high-pH stress

Albert Serra-Cardona et al. Mol Cell Biol. 2014 Dec.

Abstract

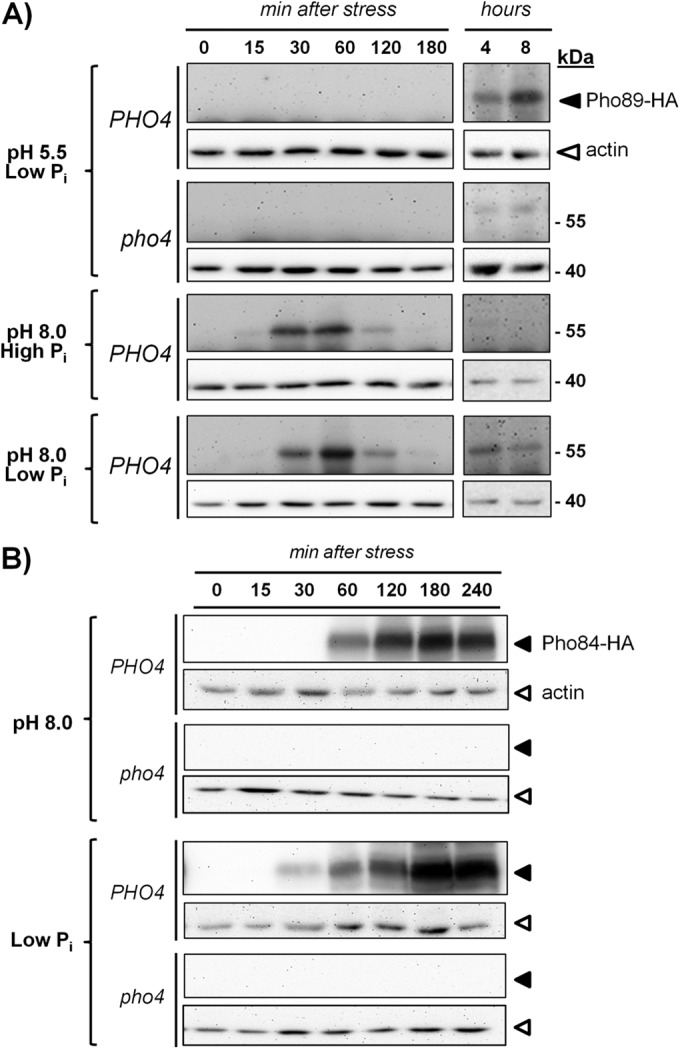
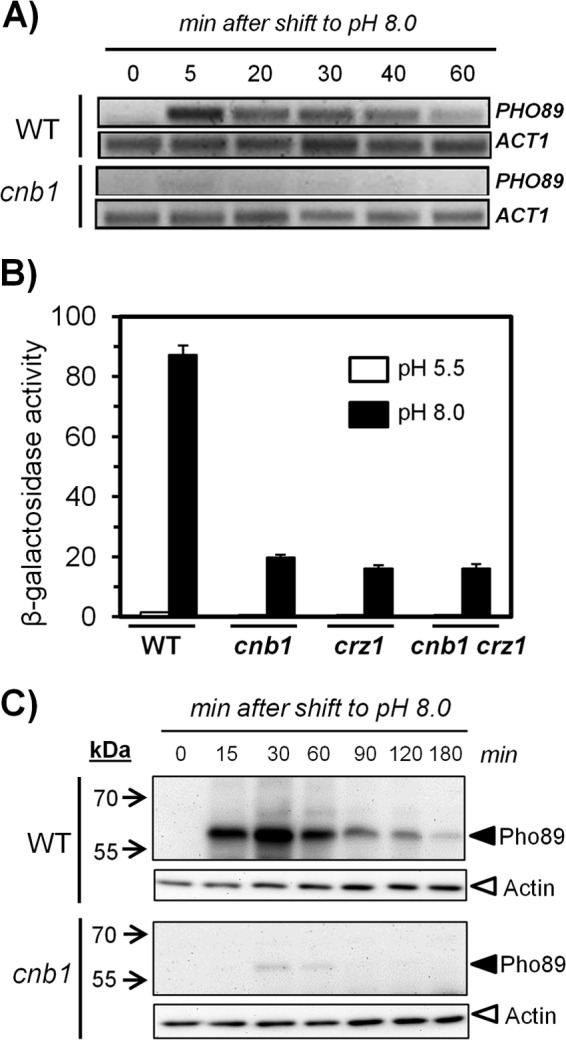
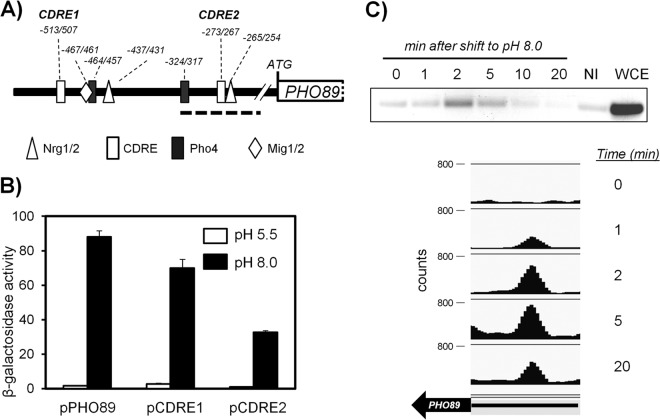
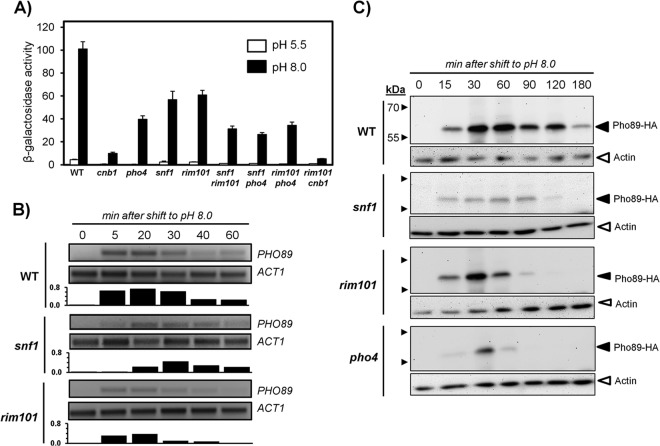
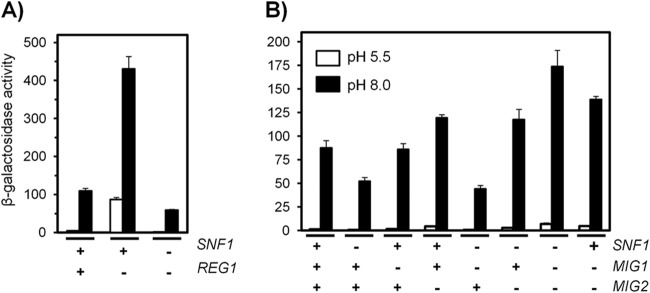
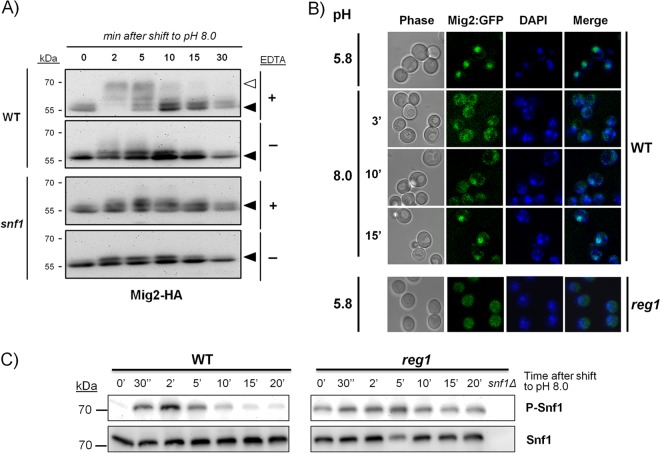
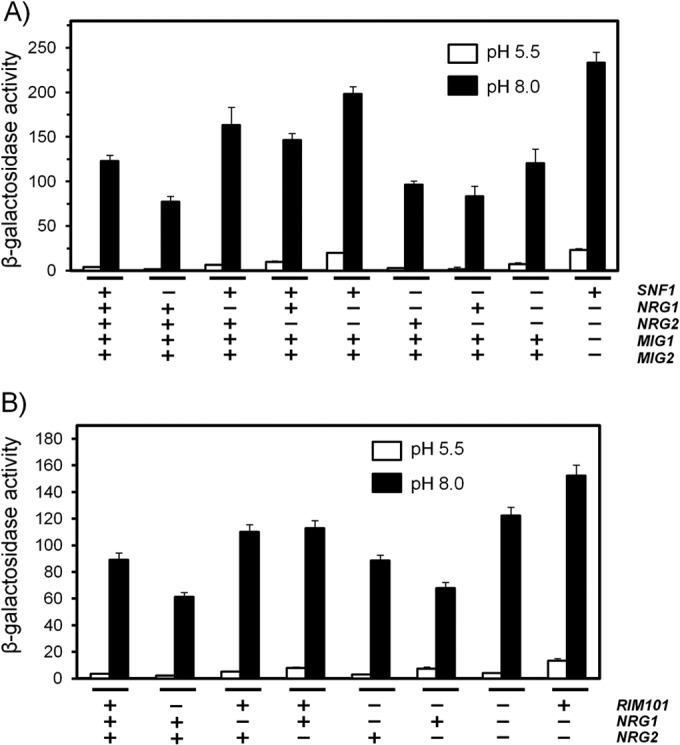
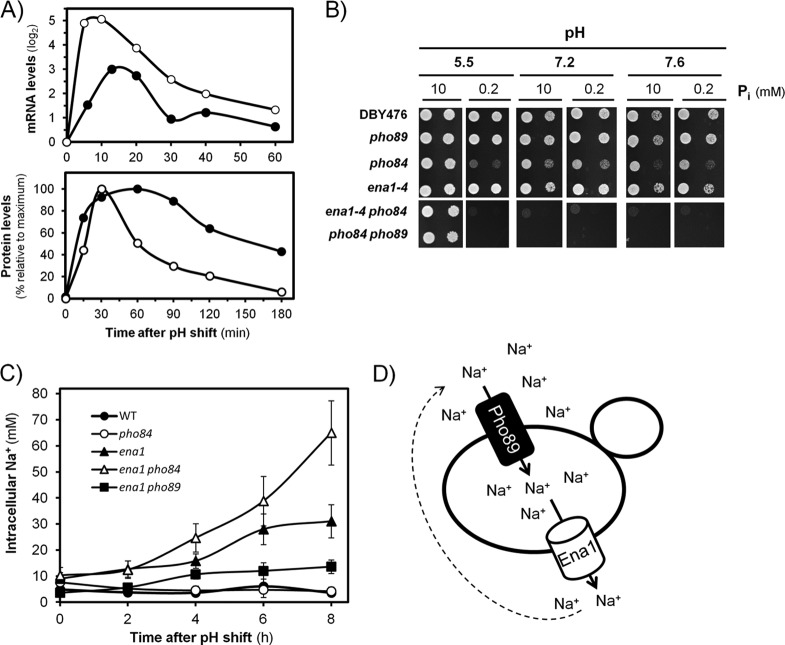
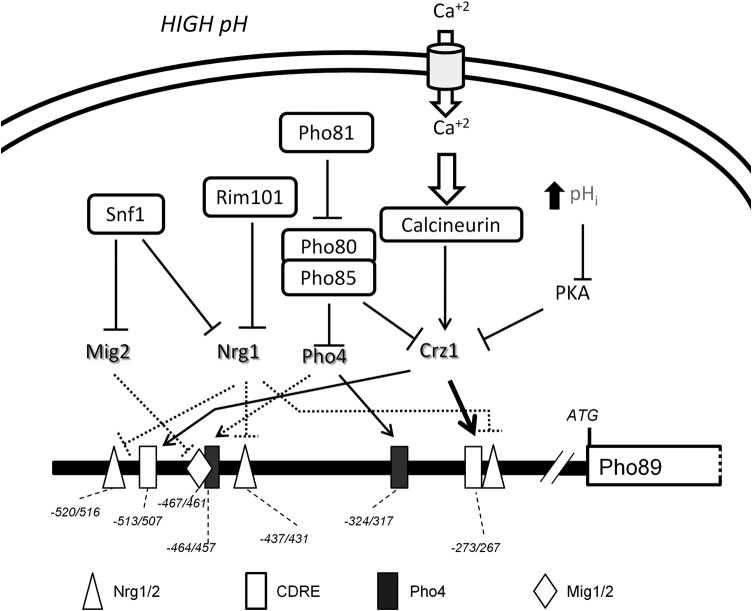
The yeast Saccharomyces cerevisiae has two main high-affinity inorganic phosphate (Pi) transporters, Pho84 and Pho89, that are functionally relevant at acidic/neutral pH and alkaline pH, respectively. Upon Pi starvation, PHO84 and PHO89 are induced by the activation of the PHO regulon by the binding of the Pho4 transcription factor to specific promoter sequences. We show that PHO89 and PHO84 are induced by alkalinization of the medium with different kinetics and that the network controlling Pho89 expression in response to alkaline pH differs from that of other members of the PHO regulon. In addition to Pho4, the PHO89 promoter is regulated by the transcriptional activator Crz1 through the calcium-activated phosphatase calcineurin, and it is under the control of several repressors (Mig2, Nrg1, and Nrg2) coordinately regulated by the Snf1 protein kinase and the Rim101 transcription factor. This network mimics the one regulating expression of the Na(+)-ATPase gene ENA1, encoding a major determinant for Na(+) detoxification. Our data highlight a scenario in which the activities of Pho89 and Ena1 are functionally coordinated to sustain growth in an alkaline environment.


Figures

FIG 1
FIG 1
Comparative accumulations of Pho89 and Pho84 in response to phosphate starvation and high-pH stress. (A) Strains ASC07 (PHO4 PHO89-3×HA) and ASC10 (pho4::LEU2 PHO89-3×HA) were grown on synthetic high-Pi medium until the OD660 reached 0.6. Cells were collected and resuspended in synthetic medium lacking phosphate supplemented with 10 mM Pi (high Pi) or 100 μM Pi (low Pi) at pH 5.5 and/or pH 8.0 and adjusted with KOH. Growth was resumed, and samples were taken at the indicated times and processed for protein extract preparation as indicated in Materials and Methods. Equivalent amounts (30 μg of total protein) were subjected to SDS-PAGE (10% polyacrylamide gels) followed by immunoblotting using anti-HA antibodies to reveal HA-tagged Pho89 (dark triangles). Membranes were stripped and reprobed with antiactin antibodies (open triangles) for loading and transfer reference. (B) Wild-type strain DBY746 and its pho4 derivative (RSC4) were transformed with centromeric plasmid pMM15-PHO84, which expresses the C-terminally HA-tagged version of Pho84. Cells were subjected to high-pH or low-phosphate stress and collected after the indicated periods, and the amount of Pho84 was assessed by using anti-HA antibodies. Correct loading and transfer were monitored with antiactin antibodies in the stripped membranes.
FIG 2
FIG 2
Expression of Pho89 in response to high-pH stress is controlled by the calcineurin/Crz1 pathway. (A) Wild-type (WT) DBY746 and MAR15 (cnb1) cells were collected at the indicated times after switching the medium to pH 8.0, and total RNA was prepared. Semiquantitative RT-PCR was carried out by using oligonucleotides specific for PHO89 and ACT1 (as a control), and the products were resolved in agarose gels and stained with GelRed (Biotium Inc.). (B) The indicated strains were transformed with the pPHO89-LacZ reporter, and exponentially growing cultures were exposed to pH 8.0 or maintained at pH 5.5 for 90 min. Cells were then collected, and β-galactosidase activity was measured as reported previously (15). Data are mean ± standard errors of the means from 12 determinations. (C) Cultures of strains ASC07 (PHO89-3×HA) and ASC08 (cnb1 PHO89-3×HA) were shifted to pH 8.0, and protein extracts were prepared. Samples (30 μg of protein) were resolved by SDS-PAGE and processed for immunoblotting as described in the legend to Fig. 1A.
FIG 3
FIG 3
Functional characterization of two potential CDREs in the PHO89 promoter. (A) Cartoon depicting the predicted regulatory sites in the PHO89 upstream region (see the text for details). The bold discontinuous line spans the region amplified from ChIP samples shown in panel C. (B) Wild-type strain DBY746 was transformed with plasmid pPHO89-LacZ, pPHO89CDRE1-LacZ, or pPHO89CDRE2-LacZ, and cultures were subjected to pH 8.0 or maintained at pH 5.5. β-Galactosidase activity was determined as described in the legend to Fig. 2B. Data are means ± standard errors of the means from 12 determinations. (C, top) Chromatin-immunoprecipitated material from cells exposed to pH 8.0 for the indicated times was subjected to PCR amplification for the 143-nt region encompassing the CDRE2 consensus (discontinuous line in panel A). NI, sample lacking anti-HA antibodies; WCE, whole-cell extract. (Bottom) ChIP samples were subjected to massive sequencing. Mapped reads were quantified, normalized, and represented by using SeqMonk software. The thick arrow represents the PHO89 open reading frame, and the thin line represents the 0.5-kbp upstream region (note that PHO89 is on the Crick strand).
FIG 4
FIG 4
PHO89 expression under conditions of high-pH stress is regulated by Snf1 and Rim101. (A) The indicated strains, transformed with the pPHO89-LacZ reporter, were exposed to pH 8.0 or maintained at pH 5.5, and β-galactosidase activity was determined. Data are means ± standard errors of the means from 10 to 15 experiments. (B) Wild-type DBY476, RSC10 (snf1), and RSC21 (rim101) cells were collected at the indicated times after switching the medium to pH 8.0, and total RNA was prepared. Semiquantitative RT-PCR was performed as described in the legend to Fig. 2A. Signals were integrated, and bars at the bottom of each panel denote the ratios between the PHO89 and ACT1 mRNAs for each time point and strain. (C) The above-mentioned strains plus strain RSC4 (pho4) were subjected to pH 8.0 for the indicated times and processed as described in the legend to Fig. 1A, and the amount of Pho89 was revealed by immunoblotting.
FIG 5
FIG 5
Regulation of PHO89 expression by Snf1 may be mediated by Mig2. (A) Wild-type strain DBY746 and its reg1 and reg1 snf1 derivatives were transformed with pPHO89-LacZ and subjected to high-pH stress (pH 8.0) (black bars) prior determination of β-galactosidase activity. (B) pPHO89-LacZ activity was measured in wild-type strain DBY746 and in strains containing different combinations of the snf1, mig1, and mig2 mutations. Data are means ± standard errors of the means from 9 to 12 experiments.
FIG 6
FIG 6
High-pH stress induces transient phosphorylation and nuclear-cytoplasmic shift of Mig2. (A) A chromosomally encoded copy of Mig2 including a C-terminal 3×HA epitope tag was introduced into cells of wild-type strain BY4741 and its snf1 derivative. After cells were exposed to pH 8.0 for the indicated times, extracts were prepared and subjected to SDS-PAGE (8% polyacrylamide gels) prior to treatment with alkaline phosphatase in the absence (−) or in the presence (+) (to prevent the action of the phosphatase) of 50 mM EDTA. Immunoblot assays were performed by using anti-HA antibodies. The open triangle denotes slower (more-phosphorylated) species. (B) Strains SP048 (wild type) and ASC34 (reg1) containing chromosomally encoded C-terminal fusions of GFP with Mig2 were shifted to pH 8.0, and the localization of the repressor was monitored by fluorescence confocal microscopy (only pH 5.8 is shown for ASC34). Nuclei were stained with DAPI to illustrate the nuclear colocalization of the GFP and DAPI signals (merged). (C) Strains DBY746 (wild type) and RSC89 (reg1) were subjected to an alkaline shift for the indicated periods, and samples (10 μl) were processed for SDS-PAGE (10% gels) and immunoblotting using anti-phospho-Thr172-AMPK (phosphorylated Snf1 [P-Snf1]) or anti-His (Snf1 protein) antibodies. An extract from strain RSC10 (snf1Δ) is included as a negative control.
FIG 7
FIG 7
Snf1 and Rim101 control PHO89 expression through Mig2 and Nrg1. The indicated strains were transformed with plasmid pPHO89-LacZ. Exponential cultures were switched to pH 8.0, and β-galactosidase activity was determined after 90 min. Data are means ± standard errors of the means from 12 to 15 experiments (A) or 20 experiments (B).
FIG 8
FIG 8
Coregulation of Pho89 and Ena1 expression allows functional coupling between both proteins under conditions of high-pH stress. (A) Concerted coregulation of Pho89 (open circles) and Ena1 (closed circles) expression. Shown are time courses for ENA1 and PHO89 mRNA accumulation (top) or protein accumulation expressed as a percentage over the maximum signal (bottom) after shifting cells from pH 5.5 to 8.0 (see Materials and Methods for details). (B) The indicated strains at an OD660 of 0.05, plus a 10-fold dilution, were spotted onto YNB-based medium (lacking phosphate and sodium) agar plates supplemented with 5 mM NaCl and the indicated amounts of potassium phosphate and adjusted to different pHs. Growth was monitored after 3 days. (C) The indicated strains were shifted for 1 h to low-Pi (0.2 mM) medium at pH 5.5 and then shifted to pH 7.8, always in the presence of 5 mM NaCl. Samples were taken at the indicated periods and processed for determination of the intracellular Na+ content. Data are means ± standard errors of the means from 4 to 8 independent experiments. (D) Illustration of the proposed functional link between Ena1 and Pho89 under high-pH stress (see the text for explanations).
FIG 9
FIG 9
Schematic depiction of regulatory inputs acting on the PHO89 promoter upon high-pH stress. Elements upstream of Snf1, Rim101, Pho81, or calcineurin are not included for clarity. Discontinuous lines indicate possible physical interactions not experimentally tested. The functional Pho4 consensus site is deduced from recently reported genome-wide data (85).

References

    1. Bun-ya M, Shikata K, Nakade S, Yompakdee C, Harashima S, Oshima Y. 1996. Two new genes, PHO86 and PHO87, involved in inorganic phosphate uptake in Saccharomyces cerevisiae. Curr. Genet. 29:344–351. 10.1007/s002940050055. - DOI - PubMed
    1. Ghillebert R, Swinnen E, De Snijder P, Smets B, Winderickx J. 2011. Differential roles for the low-affinity phosphate transporters Pho87 and Pho90 in Saccharomyces cerevisiae. Biochem. J. 434:243–251. 10.1042/BJ20101118. - DOI - PubMed
    1. Wykoff DD, O'Shea EK. 2001. Phosphate transport and sensing in Saccharomyces cerevisiae. Genetics 159:1491–1499. - PMC - PubMed
    1. Bun-ya M, Nishimura M, Harashima S, Oshima Y. 1991. The PHO84 gene of Saccharomyces cerevisiae encodes an inorganic phosphate transporter. Mol. Cell. Biol. 11:3229–3238. - PMC - PubMed
    1. Martinez P, Persson BL. 1998. Identification, cloning and characterization of a derepressible Na+-coupled phosphate transporter in Saccharomyces cerevisiae. Mol. Gen. Genet. 258:628–638. 10.1007/s004380050776. - DOI - PubMed

Publication types

MeSH terms

LinkOut - more resources