. 2014 Sep 30;94(5):963-987.
doi: 10.1111/mmi.12810. Online ahead of print.

A comparison of key aspects of gene regulation in Streptomyces coelicolor and Escherichia coli using nucleotide-resolution transcription maps produced in parallel by global and differential RNA sequencing

Affiliations

A comparison of key aspects of gene regulation in Streptomyces coelicolor and Escherichia coli using nucleotide-resolution transcription maps produced in parallel by global and differential RNA sequencing

David A Romero et al. Mol Microbiol. .

Abstract

Streptomyces coelicolor is a model for studying bacteria renowned as the foremost source of natural products used clinically. Post-genomic studies have revealed complex patterns of gene expression and links to growth, morphological development and individual genes. However, the underlying regulation remains largely obscure, but undoubtedly involves steps after transcription initiation. Here we identify sites involved in RNA processing and degradation as well as transcription within a nucleotide-resolution map of the transcriptional landscape. This was achieved by combining RNA-sequencing approaches suited to the analysis of GC-rich organisms. Escherichia coli was analysed in parallel to validate the methodology and allow comparison. Previously, sites of RNA processing and degradation had not been mapped on a transcriptome-wide scale for E. coli. Through examples, we show the value of our approach and data sets. This includes the identification of new layers of transcriptional complexity associated with several key regulators of secondary metabolism and morphological development in S. coelicolor and the identification of host-encoded leaderless mRNA and rRNA processing associated with the generation of specialized ribosomes in E. coli. New regulatory small RNAs were identified for both organisms. Overall the results illustrate the diversity in mechanisms used by different bacterial groups to facilitate and regulate gene expression.


Figures

Fig. 1
Fig. 1
M-A scatterplots of values from the differential RNA-seq analysis. (A) and (B) show data for S. coelicolor M145 and E. coli BW25113 (seq). The M values correspond to Log2 (plus/minus) and A values to (Log2 plus + Log2 minus)/2, where minus and plus refer to the number of reads before and after treatment with TAP. The points correspond to individual genome positions, not genes. For further details, see Experimental procedures. In each panel, the red line represents the upper boundary of the population of values corresponding to sites of processing and degradation (see main text). The upper boundaries were placed manually to enclose the majority of the lower population, while taking into consideration the spread of M values scattered around 0. The boundaries were then described by polynomial equations. These were M = 0.054A2 − 0.96A + 4.68 and M = −0.003A3 + 0.13A2 − 1.57A + 7.08 for S. coelicolor and E. coli respectively.
Fig. 2
Fig. 2
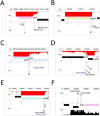
Examples of leaderless mRNAs. (A), (B), (C), (D) and (E) correspond to E. coli genes dicA (Qin prophage; b1570), pgpA (b0418), racR (Rac prophage; b1356), rhlB (b3780) and ymfK (e14 prophage; b1145) respectively. (F) corresponds to an unnamed paralogue (SCO1678) of the S. coelicolor gene whiH. The panels are modified screenshots from the UCSC Microbial Genome Browser (Chan et al., 2012). In each panel the tracks depict from top to bottom, the genome position, location of annotated genes, the positions of TSSs identified by the analysis of M-A scatterplots (Fig. 1), and the number of times each position on the corresponding strand was sequenced following fragmentation of the transcriptome (gRNA-seq). The numbers at the left of the RNA-seq tracks indicate the scale of the sequencing reads.
Fig. 3
Fig. 3
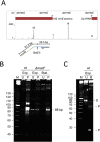
Processing at the −43 site of 16S rRNA.A. Differential RNA-seq data for the 3′ end of 16S rRNA. The screenshot is for the rrnE operon, which is representative of all seven rRNA operons in E. coli. The tracks from top to bottom show the genome position, location of the 3′ end of 16S rRNA and positions of processing sites as identified by differential RNA-seq in the absence of TAP treatment. The positions of the −43 site, sites of known cleavage by RNase III and P and a site of cleavage by an unknown RNase (labelled ‘?’) are indicated. The numbers at the left of the RNA-seq track indicates the scale of the sequencing reads. The schematic at the bottom of panel indicates the position of a BstEII site that was used to confirm the identity of an 88 bp amplicon produced by RLM-RT-PCR analysis of the −43 site (see B and C). The numbers indicate the sizes (bp) of the predicted products of cleavage at the BstEII site. It should be noted that the products have the equivalent of half a base-pair as BstEII generates 5 nt overhangs. Arrows indicate the position of primers used for PCR. Segments of the amplicon corresponding to the 5′ adaptor are drawn at an angle, while those corresponding to the 3′ end of 16S rRNA are drawn horizontally.B. RLM-RT-PCR analysis of RNA isolated from strain BW25113 (labelled wt) growing exponentially (labelled Exp.) and a congenic ΔmazF strain growing exponentially or in stationary phase (labelled Stat.). Prior to RLM-RT-PCR analysis, an aliquot of each sample was treated with T4 polynucleotide kinase (labelled P). Aliquots of untreated samples (labelled U) were also analysed. Labelling on the left indicates the sizes of molecular markers from Invitrogen (labelled M). The amplicon corresponding to the −43 cleavage site is indicated (labelled 88 bp) on the right. Products were analysed using a 10% polyacrylamide gel and stained with ethidium bromide. No amplicons were produced in the absence of reverse transcription (data not shown).C. Restriction enzyme analysis of amplicons produced from BW25113 RNA not treated with PNK. The substrate (labelled U) was incubated with BstEII and along with the resulting products (labelled B) analysed using gel electrophoresis as described in (B). Labelling on the right indicates the positions of resolvable substrate (labelled S) and products (labelled P).
Fig. 4
Fig. 4
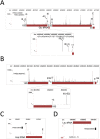
Maturation of stable RNAs.A. Annotated view of the rrnE operon of E. coli. The tracks from top to bottom show the genome position, differential RNA-seq reads in the absence of TAP treatment and the location of genes within the operon. The track containing the differential RNA-seq reads has been labelled to show the position of known cleavage sites and Class I TSSs. As Fig. 2, the labelling of the latter also indicates the stand and nucleotide position. Sites of cleavage by RNase III, E and G are labelled III, E and G respectively. The remainder of the labelling and numbering is as in Fig. 4. Inset shows positions at the 5′ end of 23S rRNA using a lower read scale.B. Annotated view of the rrnA operon of S. coelicolor. Tracks and numbering are as (A). Sites referred to in the text are labelled. Inset shows positions at the 3′ end of 16S rRNA using a lower read scale The 5′ and 3′ ends of the mature rRNAs are as determined using our global RNA-seq data.C. Processing at 5′ and 3′ end of E. coli aspV tRNA. Labelling as (B).D. Processing within the CCA at 3′ end of S. coelicolor bldA (Leu) tRNA. An arrow indicates the position of cleavage within the CCA motif.
Fig. 5
Fig. 5
Cleavage sites within mRNAs. (A), (B), (C), (D) and (E) show annotated views of the E. coli rpsT (b0023), ompA (b0957), eno (b2779), pnp (b3165) and adhE (b1241) respectively. The tracks from top to bottom show the genome positions, gRNA-seq reads, gene locations and differential RNA-seq reads (in the absence of TAP treatment). The labelled RNase E sites in rpsT mRNA produce the previously described downstream products of 147 and 106 nt (Coburn and Mackie, 1998). An additional site referred to in the text is labelled with a question mark. The labelled RNase E site in the 5′ UTR of ompA mRNA is located just downstream of the 5′ stem-loop (Rasmussen et al., 2005). The labelled RNase E sites at the 3′ end of rpsO were identified previously as M2 and M (Regnier and Portier, ; Regnier and Hajnsdorf, 1991). (F) shows an annotated view of the S. coelicolor pnp (SCO5737) gene. Tracks, as the other panels, except that the order is reversed. TSSs and cleavage sites referred to specifically in the text are labelled. The RNase III site on the downstream side was detected using a lower range of reads. As Fig. 2, the gRNA-seq data for the forward strand are colour black and have positive values, while the reverse strand is coloured red and has negative values. TSSs are labelled according to the strand, class and nucleotide position.
Fig. 6
Fig. 6
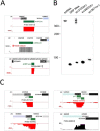
Northern blot analysis of S. coelicolor sRNAs. Labelling of sRNAs in parentheses indicates whether the sRNA is upstream (u) or downstream (d) of the nearest protein-coding gene and whether on the same (+) or opposite (−) strand.A. Annotated views of sRNAs downstream of SCO2100 on the opposite strand, downstream of SCO2822 on the opposite strand and upstream of SCO3871 on the opposite strand. The tracks from top to bottom show the genome positions, gene locations, TSSs and gRNA-seq reads.B. Northern blot analysis of sRNAs depicted in (A). The tmRNA and RNA component of the signal recognition particle were probed to provide controls. The expected sizes of the most abundant species of these controls as judged from gRNA-seq data were ∼ 400 and 80 nt respectively.C. Examples of active ribo-switching (attenuation) and a possible cis-encoded antisense RNA. The yybP element is reported to be pH responsive (Nechooshtan et al., 2009) and is found in a large number of bacteria (Barrick et al., 2004) including E. coli (Argaman et al., 2001), SCO2347 encodes an integral membrane protein. The gcvT element binds the amino acid glycine (Mandal et al., 2004), SCO1378 encodes glycine dehydrogenase. The RFN element (or FMN riboswitch) binds flavin mononucleotide (Serganov et al., 2009), SCO1443 encodes riboflavin synthase. SCO0627, the target of the putative cis-encoded asRNA, encodes a putative ATP-utilizing protein.
Fig. 7
Fig. 7
Examples of previously undetected RNAs in E. coli.A. Annotated views of the AgrA and AgrB small RNAs, the latter served as a positive control, and sRNAs encoded upstream of ispU (b0174) on the same strand, downstream of spy (b1743) on the same strand, upstream of yqcE (b2775) on the same strand, downstream of yifN (b3775) on the same strand, and downstream of qor (b4051) on the opposite strand. Labelling of sRNAs as Fig. 7. Tracks are as described in Fig. 2.B. Northern blot analysis of sRNAs depicted in (A). AgrB was probed to provide a positive control. For details of probes, see Experimental procedures.
Fig. 8
Fig. 8
Comparison of global RNA-seq and microarray data for S. coelicolor. The mean RNA-seq reads for each base within the 60 bp region targeted by a microarray probe is directly compared with the microarray signal for the same probe target. Trendline calculated by the linear model fit within R.
Fig. 9
Fig. 9
Examples of transcriptional complexity associated with key regulators of S. coelicolor metabolism and development. (A), (B), (C) and (D) shows annotated views of actII-ORFA, scbA, afsR2, and whiB respectively. Labelling is as in Fig. 2.
Fig. 10
Fig. 10
Conserved sequences in promoters associated with genes encoding the translational machinery. (A) and (B) are Weblogo representations of the promoters of S. coelicolor and E. coli respectively. The length of the space upstream of the −10 box was adjusted manually to maximize alignment of the −35 box as described previously (Lin et al., 2013). The combined height of nucleotide symbols shows the level of sequence conservation at a particular position, while the height of individual symbols within a stack of nucleotides indicates the relative frequency at that position. The nucleotide positions are numbered relative to the average position of TSSs to the point at which gaps were introduced to maximize the alignment. The numbering of position over the region of the −35 box is based on the average length of the spacer region.

References

    1. Allenby NEE, Laing E, Bucca G, Kierzek AM, Smith CP. Diverse control of metabolism and other cellular processes in Streptomyces coelicolor by the PhoP transcription factor: genome-wide identification of in vivo targets. Nucleic Acids Res. 2012;40:9543–9556. - PMC - PubMed
    1. Amitai S, Kolodkin-Gal I, Hananya-Meltabashi M, Sacher A, Engelberg-Kulka H. Escherichia coli MazF leads to the simultaneous selective synthesis of both ‘death proteins’ and ‘survival proteins’. PLoS Genet. 2009;5:e1000390. - PMC - PubMed
    1. Argaman L, Hershberg R, Vogel J, Bejerano G, Wagner EGH, Margalit H, Altuvia S. Novel small RNA-encoding genes in the intergenic regions of Escherichia coli. Curr Biol. 2001;11:941–950. - PubMed
    1. Aristarkhov A, Mikulskis A, Belasco JG, Lin ECC. Translation of the adhE transcript to produce ethanol dehydrogenase requires RNase III cleavage in Escherichia coli. J Bacteriol. 1996;178:4327–4332. - PMC - PubMed
    1. Baba T, Ara T, Hasegawa M, Takai Y, Okumura Y, Baba M, et al. Construction of Escherichia coli K-12 in-frame, single-gene knockout mutants: the Keio collection. Mol Syst Biol. 2006;2:2006 0008. - PMC - PubMed

Associated data