. 2014 Nov 14;289(46):31693-31707.
doi: 10.1074/jbc.M114.574517. Epub 2014 Sep 29.

c-Rel regulates Ezh2 expression in activated lymphocytes and malignant lymphoid cells

Affiliations

c-Rel regulates Ezh2 expression in activated lymphocytes and malignant lymphoid cells

Wen Hao Neo et al. J Biol Chem. .

Abstract

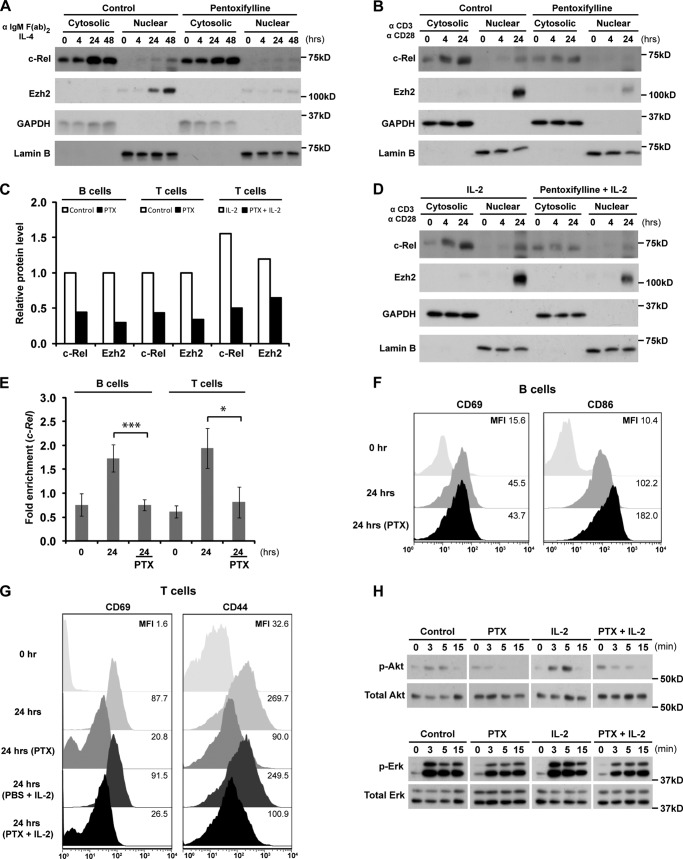
The polycomb group protein Ezh2 is a histone methyltransferase that modifies chromatin structure to alter gene expression during embryonic development, lymphocyte activation, and tumorigenesis. The mechanism by which Ezh2 expression is regulated is not well defined. In the current study, we report that c-Rel is a critical activator of Ezh2 transcription in lymphoid cells. In activated primary murine B and T cells, plus human leukemia and multiple myeloma cell lines, recruitment of c-Rel to the first intron of the Ezh2 locus promoted Ezh2 mRNA expression. This up-regulation was abolished in activated c-Rel-deficient lymphocytes and by c-Rel knockdown in Jurkat T cells. Treatment of malignant cells with the c-Rel inhibitor pentoxifylline not only reduced c-Rel nuclear translocation and Ezh2 expression, but also enhanced their sensitivity to the Ezh2-specific drug, GSK126 through increased growth inhibition and cell death. In summary, our demonstration that c-Rel regulates Ezh2 expression in lymphocytes and malignant lymphoid cells reveals a novel transcriptional network in transformed lymphoid cells expressing high levels of Ezh2 that provides a molecular justification for combinatorial drug therapy.

Keywords: Gene Regulation; Leukemia; Lymphocyte; Lymphoma; Polycomb; Transcription Factor.


Figures

FIGURE 1.
FIGURE 1.
Ezh2 expression is up-regulated in activated lymphocytes. Purified mature naïve B and T cells were stimulated with anti-IgM antibody (5 μg/ml)/IL-4 (10 ng/ml) and plate-bound anti-CD3 (10 μg/ml)/anti-CD28 (5 μg/ml) antibodies, respectively. A, total RNAs isolated from indicated postactivation time points were reverse transcribed, and Ezh2 mRNA levels were determined by semiquantitative PCR. Three-fold serial dilution of the cDNA templates was used for semiquantitative PCR amplification. The housekeeping gene HPRT was chosen as a loading control. PCR products were confirmed by sequencing. The data shown are the means ± S.D. of more than three independent experiments. B, real time RT-qPCR was conducted using TaqMan gene expression assays (ABI) and normalized against HPRT. C and D, B and T cell activations were controlled by assessing down-regulation of the resting cell marker, CD62L, and up-regulation of the activation markers, CD69 and CD86 for B cells and CD69 and CD44 for T cells, 24 h postactivation. The data shown in this figure are representative of three independent experiments.
FIGURE 2.
FIGURE 2.
Identification of regulatory regions in the Ezh2 locus. A, the CNSs in the murine Ezh2 locus as determined by Vista Browser 2.0. The positions of the minimal promoter and potential regulatory region in intron 1 are indicated by the striped box and thick black line, respectively. The positions of individual exons of Ezh2 are indicated above the sequence. The Ezh2 locus is shown in the reverse orientation. Minimal conserved width (cons. width) at 100 bp and minimal conserved identity (cons. identity) as defined by Vista Browser 2.0. B, luciferase assays were performed to identify novel regulatory regions in the Ezh2 locus. Schematic representations of the luciferase reporter constructs used are shown (left). Small light and dark blue boxes represent Ezh2 exons 1 and 2, respectively. Position +1 corresponds to the transcription start site. Different lengths of Ezh2 intron 1 were fused to the 3′ end of Ezh2 exon 1. A 220-bp DNA fragment upstream of Ezh2 exon 2 was cloned into the indicated constructs to enable splicing to occur. Small open boxes represent potential active (A1 and A2) and repressive (R1) regulatory regions of the Ezh2 locus. HEK293T cells were transfected with the indicated constructs and analyzed for luciferase activity 48 h post-transfection. Nontransfected cells (NT), as well as pGL3 enhancer (En) and pGL3-Control (Control) transfected cells, were used as internal controls for the luciferase assay. The relative luciferase activities (RLAs) of the respective constructs were normalized to Renilla luciferase activity. Relative fold changes were calculated (Calc.) using the RLA of control. The data shown are the means ± S.D. of three independent experiments. The difference between the indicated pairs was determined by two-tailed Student's t test with equal variance. **, p < 0.005; ***, p < 0.001). C, the correct splicing of each reporter construct was examined by RT-PCR with the indicated primer pairs (arrows). Properly spliced constructs generated a 168-bp band, except in the case of the MP construct, which gave rise to a 99-bp band.
FIGURE 3.
FIGURE 3.
Identification of potential Ezh2 regulators using a candidate gene approach. HEK293T cells were co-transfected with the indicated minimal promoter constructs and transcription factor expression vectors. E2F and p53 were used as positive and negative controls, respectively. Luciferase activity was analyzed 48 h post-transfection. RLA was normalized to Renilla luciferase activity. Relative fold changes were calculated using the RLA of the empty vector control (EV). The data shown are the means ± S.D. of three independent experiments. The significant differences between cells expressing individual transcription factors and empty vector control were determined by two-tailed Student's t test with equal variance. *, p < 0.01; **, p < 0.005; ***, p < 0.001.
FIGURE 4.
FIGURE 4.
c-Rel binds to intron 1 of the Ezh2 locus. A, c-Rel binding sites in the Ezh2 locus were predicted using rVista2.0 and TFSEARCH. Predicted c-Rel binding sites are designated with boxes in the DNA fragments shown. The degree of conservation between human and mouse sequence was analyzed with ClustalW (60), and conserved nucleotides are indicated by asterisks. The transcription start site is defined as +1. B, c-Rel controls Ezh2 luciferase reporter activity in a dose-dependent manner. HEK293T cells were transfected with the MP/+838 reporter construct and different amounts of c-Rel expression vector, as indicated. Luciferase activity was analyzed and normalized as described in Fig. 3. c-Rel protein levels in nuclear fractions were analyzed by Western blot, and Lamin B was used as a loading control. C, c-Rel up-regulates endogenous Ezh2 expression in HEK293T cells. Ezh2 expression levels in whole cell lysates at the indicated times post-transfection were analyzed by Western blot. The fold changes of Ezh2 expression levels compared with the nontransfected (NT) control are shown below the Western blot. Levels of overexpressed c-Rel were also observed by Western blot. Tubulin was used as a loading control. D, sites 1 and 2 are dispensable for c-Rel-mediated up-regulation of MP/+838 luciferase reporter activity. MP/+838 reporter constructs with c-Rel binding site 1 or 2 deletions were co-transfected with c-Rel expression vector in HEK293T cells. Relative fold change was calculated using the RLA of wild-type MP/+838 without c-Rel co-expression. E, c-Rel-mediated up-regulation of MP/+838 luciferase reporter activity was abolished upon site 4 (+779 to +788) deletion. MP/+838 reporter constructs with c-Rel binding site 3 or 4 deletions were co-transfected with c-Rel expression vector. Relative fold change was calculated using the RLA of wild-type MP/+838 without c-Rel co-expression. 3* indicates construct after removal of the artificial c-Rel binding site that is generated upon deletion of site 3. F, c-Rel regulates Ezh2 reporter expression in lymphoid lineage cells. Luciferase assays done in E were repeated in lymphoid lineage Jurkat T cells. G, c-Rel regulates the expression of mouse and humanized Ezh2 reporters. The mouse site 4 (including 20 nucleotides both up- and downstream of this site) was replaced with corresponding human site sequence (site 4 Hsa) in the mouse reporter construct MP/+838 (site 4 Mmu). The luciferase activities of these constructs were measured with or without exogenous c-Rel expression. The data shown in D–G are the means ± S.D. of technical triplicates from one experiment representative of three independent experiments. The differences between indicated pairs were determined by two-tailed Student's t test with equal variance. **, p < 0.005; ***, p < 0.001).
FIGURE 5.
FIGURE 5.
Recruitment of c-Rel to the Ezh2 locus in activated lymphocytes. A and B, c-Rel nuclear translocation is correlated with Ezh2 up-regulation. B (A) and T (B) cells were activated as described in Fig. 1. Cytosolic and nuclear fractions were isolated at the indicated postactivation time points, and Ezh2 and c-Rel expression levels were analyzed by Western blot. GAPDH and Lamin B were used as loading controls for the cytosolic and nuclear fractions, respectively. The data shown in this figure are representative of three independent experiments. C, schematic representation of the Ezh2 locus and the corresponding positions of PCR products generated in ChIP analysis. The transcription start site is defined as +1. The first exon of Ezh2 (open box) and the c-Rel binding site (black triangle) are shown. PCR products are indicated by gray lines with position numbers. D and E, c-Rel was recruited to the Ezh2 locus in primary B and T cells. Cells were stimulated, and activation was confirmed as described in Fig. 1. B (D) and T (E) cells were fixed and sonicated. Chromatin was immunoprecipitated with anti-c-Rel antibody, and purified DNAs were amplified by qPCR (left) or semiquantitative PCR (right). IgG antibody was used as a negative control. For qPCR, samples were normalized to input and expressed as fold enrichment compared with IgG controls. F, c-Rel associates with mouse and human site 4. DNA affinity precipitation assays using biotinylated either mouse wild-type site 4 (Mmu), deleted mouse site 4 (Mmu*), or human site 4 probes (Hsa) were performed. Binding proteins were resolved on SDS-PAGE, and c-Rel was detected by specific antibody. Probe sequences are indicated in the low panel. Boxes show the position of site 4 or remaining nucleotide residue after site 4 deletion in Mmu* probe. G and H, recruitment of c-Rel to the Ezh2 locus is correlated with acetylated histone H3. ChIP was performed using activated B (G) and T (H) cells as described above with antibody specific to acetylated histone H3 (H3Ac) and DNAs were amplified by qPCR. A–D on the x axis indicate the positions of PCR products that are described in C. Bar graphs shown in the figure are the means ± S.D. of more than three independent experiments. The differences between the indicated pairs were significant as determined by two-tailed Student's t test with equal variance. **, p < 0.005; ***, p < 0.001.
FIGURE 6.
FIGURE 6.
c-Rel is critical for Ezh2 up-regulation in activated lymphocytes. Purified murine T and B cells were stimulated as described in Fig. 1. Total RNAs isolated from resting or activated control (wt) and c-Rel-deficient (c-Rel−/−) lymphocytes (24 h upon stimulation) were reverse transcribed, and c-Rel (A), Ezh2 (B), and RelA (C) mRNA levels were determined by qPCR and normalized against HPRT. The data shown in the figure are the means ± S.D. of three independent experiments. The differences between the indicated pairs were significant as determined by two-tailed Student's t test with equal variance. *, p < 0.01; **, p < 0.005; ***, p < 0.001; NS, not significant (p > 0.01).
FIGURE 7.
FIGURE 7.
Pentoxifylline prevents the recruitment of c-Rel to the Ezh2 locus and up-regulation of Ezh2 in activated lymphocytes. Purified B (A and C) and T (B and C) cells were activated as described in Fig. 1. In addition, T cells were stimulated without (B and C) or with 20 ng/ml IL-2 (C and D). Cytosolic and nuclear fractions were isolated at the indicated time points postactivation. Ezh2 and c-Rel expression levels in cytosolic and nuclear fractions were analyzed by Western blot. GAPDH and Lamin B were used as loading controls for the cytosolic and nuclear fractions, respectively. PTX indicates lysates isolated from B or T cells pretreated with 300 μg/ml pentoxifylline for 10 min prior stimulation. C, quantification of the band intensities for nuclear c-Rel and Ezh2 protein levels 24 h post-stimulation shown in A, B, and D. E, reduced recruitment of c-Rel to the Ezh2 locus in activated B (left) and T (right) cells upon PTX treatment was observed by ChIP assay, as described for Fig. 5 (D and E). The purified DNAs were analyzed by qPCR. The data shown in the figure are the means ± S.D. of more than three independent experiments. The differences between the indicated pairs were significant as determined by two-tailed Student's t test with equal variance. *, p < 0.01; ***, p < 0.001. F and G, B (F) and T (G) cell activations with or without PTX and IL-2 treatments were analyzed by assessing the up-regulation of activation markers by FACS (CD69 and CD86 for B cells; CD69 and CD44 for T cells) 24 h postactivation. The numbers in the graph indicate mean fluorescence intensity of the indicated staining on each population. H, T cells were activated with biotinylated anti-CD3 (5 μg/ml) and anti-CD28 (5 μg/ml) antibodies with or without 20 ng/ml IL-2. CD3 and CD28 were cross-linked with 25 μg/ml recombinant streptavidin. Cytosolic fractions were isolated at the indicated time points postactivation. Phosphorylated Akt and Erk levels were analyzed by Western blot. Total Akt and Erk protein levels were used as loading controls. The data shown in this figure are representative of three independent experiments.
FIGURE 8.
FIGURE 8.
The combination of PTX and the Ezh2 inhibitor, GSK126, effectively inhibits the survival and growth of leukemia and lymphoma cell lines. A, PTX treatment down-regulates EZH2 expression in Jurkat and MM1S lymphoma cell lines. Cytosolic and nuclear fractions were isolated from cells at the indicated time points postactivation. EZH2 expression levels in cytosolic and nuclear fractions were analyzed by Western blot. GAPDH and Lamin B were used as loading controls for the cytosolic and nuclear fractions, respectively. The data shown in this figure are representative of three independent experiments. B, c-Rel recruitment to the EZH2 locus in Jurkat or MM1S cells, as determined by ChIP assay, was significantly inhibited by PTX treatment. The data shown in the figure are the means ± S.D. of more than three independent experiments. The differences between the indicated pairs were significant as determined by two-tailed Student's t test with equal variance. ***, p < 0.001. C, c-Rel regulates EZH2 expression in Jurkat T cells. c-Rel expression in Jurkat T cells was knocked down by specific siRNA through electroporation. Live cells were purified by lympholyte gradient (Cedarlane Laboratories). Total RNAs isolated from control or knockdown cells (0, 6, and 24 h after transfection) were reverse transcribed, and c-rel, EZH2, and relA mRNA levels were determined by qPCR and normalized against HPRT. D and E, IC50 values of GSK126 in combination with indicated concentrations of PTX in Jurkat (D) and MM1S (E) cells. Cell viability was accessed by MTT assays. The IC50 value of GSK126 for Jurkat or MM1S cells at a defined PTX concentration was calculated based on the survival curve of cells treated with five different concentrations of GSK126: 1250, 2500, 5000, 10,000, and 25,000 nm (for Jurkat) and 20,000 nm (for MM1S). F and G, dose-dependent effects of PTX treatment on cell viability over time in Jurkat (F) or MM1S (G) cells. FACS analysis of annexin V/PI staining was used to determine cell viabilities. Live cells (black columns, annexin VPI), early apoptotic cells (dark gray columns, annexin V+PI), late apoptotic cells (light gray columns, annexin V+PI+), and dead cells (white columns, annexin VPI+) are shown. The data shown in the figure are the means ± S.D. of more than three independent experiments. H, combinatorial effects of PTX and GSK126 treatment on cell viability in Jurkat and MM1S cells. Jurkat and MM1S cells were cultured in the presence of vehicle control (PBS or DMSO), 10 μm GSK126, 900 or 600 μg/ml PTX as indicated, or both drugs for the indicated periods of time. Cell viabilities were determined by FACS as described above in F and G. Viable cells were defined as annexin VPI.

Similar articles

Cited by

References

    1. Lewis E. B. (1978) A gene complex controlling segmentation in Drosophila. Nature 276, 565–570 - PubMed
    1. Czermin B., Melfi R., McCabe D., Seitz V., Imhof A., Pirrotta V. (2002) Drosophila enhancer of Zeste/ESC complexes have a histone H3 methyltransferase activity that marks chromosomal polycomb sites. Cell 111, 185–196 - PubMed
    1. Francis N. J., Saurin A. J., Shao Z., Kingston R. E. (2001) Reconstitution of a functional core polycomb repressive complex. Mol. Cell 8, 545–556 - PubMed
    1. Klymenko T., Papp B., Fischle W., Köcher T., Schelder M., Fritsch C., Wild B., Wilm M., Müller J. (2006) A polycomb group protein complex with sequence-specific DNA-binding and selective methyl-lysine-binding activities. Genes Dev. 20, 1110–1122 - PMC - PubMed
    1. Müller J., Hart C. M., Francis N. J., Vargas M. L., Sengupta A., Wild B., Miller E. L., O'Connor M. B., Kingston R. E., Simon J. A. (2002) Histone methyltransferase activity of a Drosophila polycomb group repressor complex. Cell 111, 197–208 - PubMed

Publication types

MeSH terms

LinkOut - more resources