A direct interaction between the sigma-1 receptor and the hERG voltage-gated K+ channel revealed by atomic force microscopy and homogeneous time-resolved fluorescence (HTRF®)
- PMID: 25266722
- PMCID: PMC4231707
- DOI: 10.1074/jbc.M114.603506
A direct interaction between the sigma-1 receptor and the hERG voltage-gated K+ channel revealed by atomic force microscopy and homogeneous time-resolved fluorescence (HTRF®)
Abstract
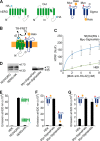
The sigma-1 receptor is an endoplasmic reticulum chaperone protein, widely expressed in central and peripheral tissues, which can translocate to the plasma membrane and modulate the function of various ion channels. The human ether-à-go-go-related gene encodes hERG, a cardiac voltage-gated K(+) channel that is abnormally expressed in many human cancers and is known to interact functionally with the sigma-1 receptor. Our aim was to investigate the nature of the interaction between the sigma-1 receptor and hERG. We show that the two proteins can be co-isolated from a detergent extract of stably transfected HEK-293 cells, consistent with a direct interaction between them. Atomic force microscopy imaging of the isolated protein confirmed the direct binding of the sigma-1 receptor to hERG monomers, dimers, and tetramers. hERG dimers and tetramers became both singly and doubly decorated by sigma-1 receptors; however, hERG monomers were only singly decorated. The distribution of angles between pairs of sigma-1 receptors bound to hERG tetramers had two peaks, at ∼90 and ∼180° in a ratio of ∼2:1, indicating that the sigma-1 receptor interacts with hERG with 4-fold symmetry. Homogeneous time-resolved fluorescence (HTRF®) allowed the detection of the interaction between the sigma-1 receptor and hERG within the plane of the plasma membrane. This interaction was resistant to sigma ligands, but was decreased in response to cholesterol depletion of the membrane. We suggest that the sigma-1 receptor may bind to hERG in the endoplasmic reticulum, aiding its assembly and trafficking to the plasma membrane.
Keywords: Atomic Force Microscopy (AFM); Fluorescence Resonance Energy Transfer (FRET); Molecular Imaging; Protein Complex; Sigma Receptor; hERG.
© 2014 by The American Society for Biochemistry and Molecular Biology, Inc.
Figures


Similar articles
-
Progesterone impairs human ether-a-go-go-related gene (HERG) trafficking by disruption of intracellular cholesterol homeostasis.J Biol Chem. 2011 Jun 24;286(25):22186-94. doi: 10.1074/jbc.M110.198853. Epub 2011 Apr 27. J Biol Chem. 2011. PMID: 21525004 Free PMC article.
-
Protein kinase A activity at the endoplasmic reticulum surface is responsible for augmentation of human ether-a-go-go-related gene product (HERG).J Biol Chem. 2011 Jun 17;286(24):21927-36. doi: 10.1074/jbc.M110.201699. Epub 2011 May 2. J Biol Chem. 2011. PMID: 21536683 Free PMC article.
-
Interaction with GM130 during HERG ion channel trafficking. Disruption by type 2 congenital long QT syndrome mutations. Human Ether-à-go-go-Related Gene.J Biol Chem. 2002 Dec 6;277(49):47779-85. doi: 10.1074/jbc.M206638200. Epub 2002 Sep 20. J Biol Chem. 2002. PMID: 12270925
-
HERG channel trafficking.Novartis Found Symp. 2005;266:57-69; discussion 70-4, 95-9. Novartis Found Symp. 2005. PMID: 16050262 Review.
-
SIGMAR1 Confers Innate Resilience against Neurodegeneration.Int J Mol Sci. 2023 Apr 24;24(9):7767. doi: 10.3390/ijms24097767. Int J Mol Sci. 2023. PMID: 37175473 Free PMC article. Review.
Cited by
-
Neuronal Sigma-1 Receptors: Signaling Functions and Protective Roles in Neurodegenerative Diseases.Front Neurosci. 2019 Aug 28;13:862. doi: 10.3389/fnins.2019.00862. eCollection 2019. Front Neurosci. 2019. PMID: 31551669 Free PMC article. Review.
-
Role of the Sigma-1 receptor in Amyotrophic Lateral Sclerosis (ALS).J Pharmacol Sci. 2015 Jan;127(1):10-6. doi: 10.1016/j.jphs.2014.12.013. Epub 2015 Jan 5. J Pharmacol Sci. 2015. PMID: 25704013 Free PMC article. Review.
-
Sigma-1 and Sigma-2 receptor ligands induce apoptosis and autophagy but have opposite effect on cell proliferation in uveal melanoma.Oncotarget. 2017 Jul 25;8(53):91099-91111. doi: 10.18632/oncotarget.19556. eCollection 2017 Oct 31. Oncotarget. 2017. PMID: 29207628 Free PMC article.
-
Structural model of FeoB, the iron transporter from Pseudomonas aeruginosa, predicts a cysteine lined, GTP-gated pore.Biosci Rep. 2016 Apr 27;36(2):e00322. doi: 10.1042/BSR20160046. Print 2016. Biosci Rep. 2016. PMID: 26934982 Free PMC article.
-
Hypothesis: The Psychedelic Ayahuasca Heals Traumatic Memories via a Sigma 1 Receptor-Mediated Epigenetic-Mnemonic Process.Front Pharmacol. 2018 Apr 5;9:330. doi: 10.3389/fphar.2018.00330. eCollection 2018. Front Pharmacol. 2018. PMID: 29674970 Free PMC article.
References
-
- Martin W. R., Eades C. G., Thompson J. A., Huppler R. E., Gilbert P. E. (1976) The effects of morphine- and nalorphine-like drugs in the nondependent and morphine-dependent chronic spinal dog. J. Pharmacol. Exp. Ther. 197, 517–532 - PubMed
-
- Monnet F. P. (2005) Sigma-1 receptor as regulator of neuronal intracellular Ca2+: clinical and therapeutic relevance. Biol. Cell 97, 873–883 - PubMed
-
- Tsai S. Y., Hayashi T., Harvey B. K., Wang Y., Wu W. W., Shen R. F., Zhang Y., Becker K. G., Hoffer B. J., Su T.-P. (2009) Sigma-1 receptors regulate hippocampal dendritic spine formation via a free radical-sensitive mechanism involving Rac1·GTP pathway. Proc. Natl. Acad. Sci. U.S.A. 106, 22468–22473 - PMC - PubMed
Publication types
MeSH terms
Substances
LinkOut - more resources
Full Text Sources
Other Literature Sources
Miscellaneous

