. 2014 Sep 30:10.1111/mmi.12811.
doi: 10.1111/mmi.12811. Online ahead of print.

A Caulobacter MreB mutant with irregular cell shape exhibits compensatory widening to maintain a preferred surface area to volume ratio

Affiliations

A Caulobacter MreB mutant with irregular cell shape exhibits compensatory widening to maintain a preferred surface area to volume ratio

Leigh K Harris et al. Mol Microbiol. .

Abstract

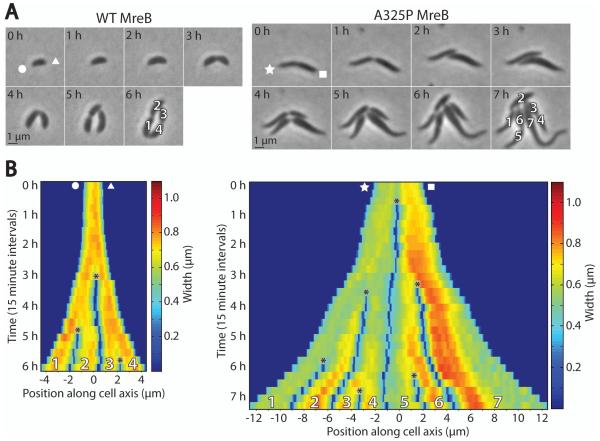
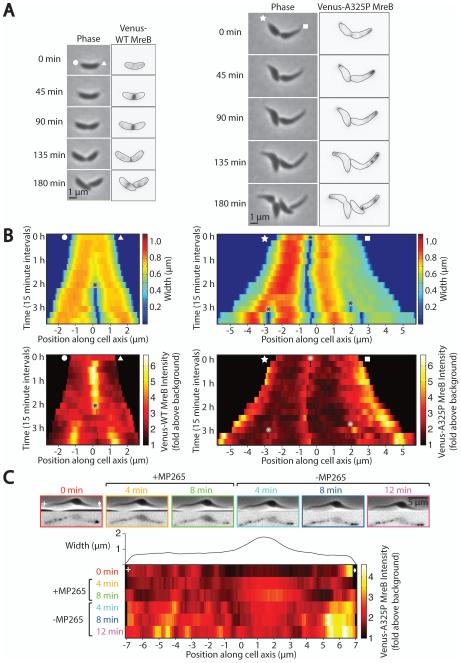
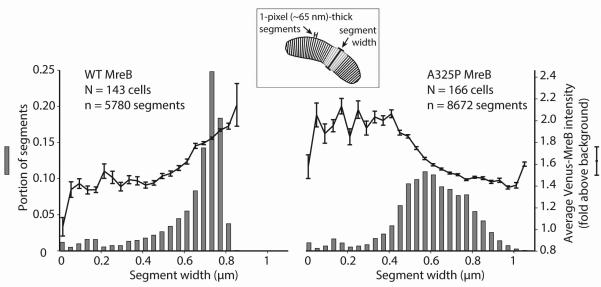
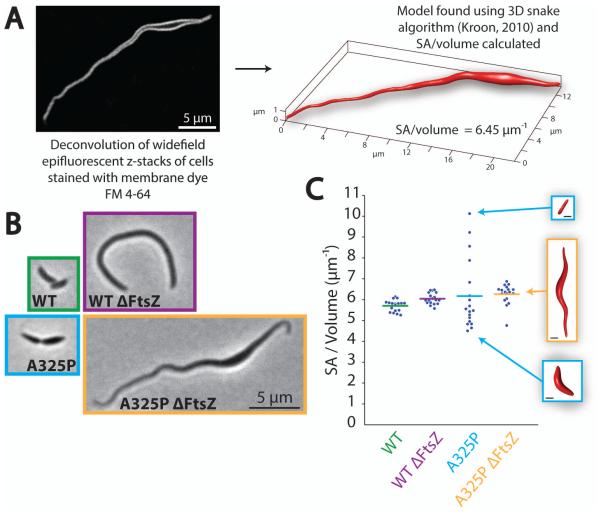
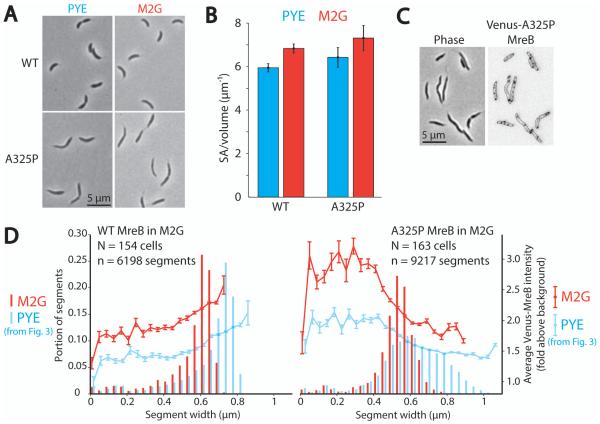
Rod-shaped bacteria typically elongate at a uniform width. To investigate the genetic and physiological determinants involved in this process, we studied a mutation in the morphogenetic protein MreB in Caulobacter crescentus that gives rise to cells with a variable-width phenotype, where cells have regions that are both thinner and wider than wild-type. During growth, individual cells develop a balance of wide and thin regions, and mutant MreB dynamically localizes to poles and thin regions. Surprisingly, the surface area to volume ratio of these irregularly shaped cells is, on average, very similar to wild-type. We propose that, while mutant MreB localizes to thin regions and promotes rod-like growth there, wide regions develop as a compensatory mechanism, allowing cells to maintain a wild-type-like surface area to volume ratio. To support this model, we have shown that cell widening is abrogated in growth conditions that promote higher surface area to volume ratios, and we have observed individual cells with high ratios return to wild-type levels over several hours by developing wide regions, suggesting that compensation can take place at the level of individual cells.


Figures

Fig. 1
Fig. 1
mreBA325P cells maintain a variable-width phenotype over time. A. Time-lapse phase contrast images of representative wild-type C. crescentus (CB15N) and mreBA325P cells. White shapes (circle, triangle, star, square) denote which cell pole corresponds to which side of the kymographs in (B). See also Supplementary Movies S1 and S2. B. Kymographs of width along the major cell axes from (A). Cells were laid out end to end from left to right. Asterisks denote cell divisions. Color represents cell width at each position along the major axis. Numbers at bottom correspond to cells in the final frame of (A).
Fig. 2
Fig. 2
Venus-MreBA325P is dynamically localized to thin regions of cells. A. Representative time-lapse phase contrast and epifluorescence images of wild-type and mreBA325P cells expressing Venus-MreB (left) or Venus-MreBA325P (right). Expression of fluorescent protein was induced for 1 h prior to and during imaging. These and all subsequent fluorescence images have been inverted for ease of viewing. Indicated cell outlines were identified using MicrobeTracker (Sliusarenko et al., 2011). White shapes (circle, triangle, star, square) denote which cell pole corresponds to which side of the kymographs in (B). B. Kymographs of cell width and Venus-MreB localization from (A). Color represents cell width (top) and Venus-MreB fluorescence intensity (bottom). Asterisks denote cell divisions. C. Representative time-lapse phase contrast and epifluorescence images of an A325P cell prior to, during, and after treatment with 150 μg ml−1 of the MreB inhibitor MP265. Expression of fluorescent protein was induced for 1 h prior to but not during imaging. Images were taken every 4 minutes and MP265 was added immediately after the 0 min image (outlined in red) and removed immediately after the 8 min image (outlined in green). Venus-MreBA325P fluorescence intensity along the long cell axis at each timepoint is plotted in the kymograph below, where color represents fluorescence intensity, and cell width at each position is plotted directly above the kymograph. White shapes (plus, diamond) indicate the left and right cell poles respectively.
Fig. 3
Fig. 3
A population of mreBA325P cells contains a broad distribution of widths and Venus-MreBA325P localizes predominantly in thin regions. Histograms of cell widths for large populations of wild-type and mreBA325P cells expressing Venus-MreB and Venus-MreBA325P respectively. Cells were divided into 1-pixel (~65 nm)-thick segments along their long axes, and segments were binned according to width. Note that the average number of segments per cell was greater for mreBA325P because these cells were often longer than wild-type. The mean Venus-MreB intensity of segments in each width bin was calculated and is overlaid on top of the histograms. Error bars represent the standard error of the mean.
Fig. 4
Fig. 4
Circumferential motion of Venus-MreBA325P is similar to Venus-MreB. A. Time-lapse TIRF images of wild-type and mreBA325P cells expressing very low levels of Venus-MreB and Venus-MreBA325P respectively. Images were taken every 8 s with 300 ms exposures. Cells were genetically depleted of FtsZ by growing a strain with FtsZ under an inducible promoter under non-inducing conditions so that wild-type MreB would not accumulate in a band at midcell, obscuring individual MreB puncta (see Experimental Procedures). Wild-type and mreBA325P cells were depleted of FtsZ for 3 h prior to imaging, and Venus-MreB and Venus-MreBA325P were induced for 1 h prior. Shown are examples of MreB puncta that moved persistently across cells, perpendicular to the cell axis. Red lines show the progress of tracks over time. B. Plot of the fraction of automatically detected wild-type and A325P MreB tracks that met various cutoffs for track persistence and perpendicularity (see Experimental Procedures). For wild-type, N = 147 cells and n = 305 total tracks, and for A325P, N = 39 cells and n = 360 total tracks. Tracks were filtered by persistence, or the average of the cosines of the angles between successive steps in a track, and by perpendicularity, or the average of the cosines squared of the angles made between each track segment and a line perpendicular to the long axis of the cell. Inset diagrams depict the angles used to calculate persistence and perpendicularity. C. Histogram of track speeds. The track persistence cutoff used was 0 and the track perpendicularity cutoff was 0.5. The average speed for wild-type was 7.3±3.7 nm/sec, and the average speed for A325P was 6.5±4.0 nm/sec (± standard deviation). These distributions are not significantly different (p = 0.33 as determined by two-sample Kolmogorov-Smirnov test). D. Time-lapse TIRF images of Venus-MreBA325P acquired as described in (A). The black arrowhead marks a long-lived, stationary spot. E. Histogram of track duration for all automatically detected tracks. Note that to be detected tracks were required to last for at least 24 seconds. The average duration for wild-type was 36±20 seconds, and the average duration for A325P was 46±27 seconds (± standard deviation). These distributions are significantly different (p < 0.001 as determined by two-sample Kolmogorov-Smirnov test). F. Plot of the fraction of wild-type and A325P tracks counted as stationary spots using various cutoffs for stationary spot duration and total distance traveled.
Fig. 5
Fig. 5
FtsZ is not required for the development or expansion of wide regions in mreBA325P cells. A. Phase contrast image of filamentous mreBA325P cells genetically depleted of FtsZ. To deplete FtsZ in this strain, FtsZ was expressed under an inducible promoter and cells were grown in non-inducing conditions (see Experimental Procedures). B. Time-lapse phase contrast images of an mreBA325P cell depleted of FtsZ as in (A). FtsZ was completely depleted prior to imaging and depletion continued throughout. White shapes (plus and diamond) mark the left and right poles of the cell and correspond to kymograph in (C). C. Kymograph of cell width during growth of the FtsZ-depleted mreBA325P cell shown in (B). See also Supplementary Movie S4. D. Time-lapse phase contrast and epifluorescence images of mreBA325P cells genetically depleted of FtsZ as in (A) during induction of Venus-MreBA325P. Fluorescent MreB was induced at the start of imaging, and time stamps reflect time since imaging and induction began. Red and blue cell number labels refer to the left and right cells respectively and are referred to in parts (E) and (F). White shapes (circle, triangle, square, star) refer to the left and right poles of cells 1 and 2 and correspond to the kymographs in E. E. Kymographs of cell width and Venus-MreBA325P fluorescence intensity in cells 1 and 2 from (D) during growth and induction of fluorescent protein. Color represents cell width in the top kymograph and Venus-MreBA325P fluorescence intensity in the bottom kymograph. F. Scatter plot of the surface area to volume ratios of cells 1 and 2 from (D) and (E) over time. Surface area to volume ratios were calculated using MicrobeTracker (Sliusarenko et al., 2011) and treating each pixel-thick segment as a 3D disk with cylindrical symmetry.
Fig. 6
Fig. 6
The average surface area to volume ratio of mreBA325P cells is comparable to wild-type. A. Summary of scheme for determining accurate surface area to volume ratios. Shown is one non-inverted slice of a deconvolved epifluorescent z-stack of an FtsZ-depleted mreBA325P cell stained with membrane dye FM 4-64, as well as the 3D mesh of this cell calculated using a 3D snake algorithm (Kroon, 2010). B. Representative phase contrast images of dividing and FtsZ-depleted wild-type and mreBA325P cells. All images are at the same scale. C. Plot of surface area to volume ratios for N = 18 cells from each condition in (B) determined using the scheme in (A). Horizontal bars mark the mean of each distribution and inset images show the 3D meshes corresponding to the indicated data points. All inset images are at the same scale and the scale bars represent 1 μm.
Fig. 7
Fig. 7
Growth in minimal media increases cell surface area to volume ratio and in mreBA325P results in the loss of wide regions. A. Representative phase contrast images of wild-type and mreBA325P cells grown in PYE (rich media) or M2G (minimal media). B. Bar graph of average surface area to volume ratio of n > 84 cells from each condition in (A). Error bars represent the standard deviation. C. Phase contrast and epifluorescence image of mreBA325P cells grown in M2G and expressing Venus-MreBA325P. Fluorescent MreB was induced 1 h prior to imaging. D. Histograms of cell width and plots of width-specific mean Venus-MreB intensity for many wild-type and mreBA325P cells expressing Venus-MreB and Venus-MreBA325P respectively and grown in PYE and M2G. PYE data is the same as Fig. 3. Cells were divided into pixel-thick segments along their long axes and segments were binned according to width. The mean Venus-MreB intensity of segments in each width bin is plotted on top of the histograms. Error bars represent the standard error of the mean. Note that fluorescence signal quantified as fold above background is generally higher in M2G because the rich medium, PYE, has more autofluorescence and thus higher background.
Fig. 8
Fig. 8
Entirely thin mreBA325P cells with elevated surface area to volume ratios return to wild-type-like levels by developing wide regions. A. Plots of individual cell surface area to volume ratio trajectories over time. The surface area to volume ratios for the wild-type and mreBA325P cells in Fig. 1 were plotted over time. Colored lines represent individual cells, and after division daughters are assigned new colors. Numbers correspond to numbering in Fig. 1. See also Supplementary Movie S5. B. Model for maintenance of the variable-width phenotype in mreBA325P cells. We propose that MreBA325P promotes rod-like growth in thin regions of cells, and that compensatory growth in wide regions allows cells to return to wild-type-like surface area to volume ratios.

Similar articles

Cited by

References

    1. Aaron M, Charbon G, Lam H, Schwarz H, Vollmer W, Jacobs-Wagner C. The tubulin homologue FtsZ contributes to cell elongation by guiding cell wall precursor synthesis in Caulobacter crescentus. Mol Microbiol. 2007;64:938–952. - PubMed
    1. Alyahya SA, Alexander R, Costa T, Henriques AO, Emonet T, Jacobs-Wagner C. RodZ, a component of the bacterial core morphogenic apparatus. Proc Natl Acad Sci. 2009;106:1239–1244. - PMC - PubMed
    1. Bendezú FO, Hale CA, Bernhardt TG, Boer PAJ. RodZ (YfgA) is required for proper assembly of the MreB actin cytoskeleton and cell shape in E. coli. EMBO J. 2009;28:193–204. de. - PMC - PubMed
    1. Cabeen MT, Jacobs-Wagner C. Bacterial cell shape. Nat Rev Micro. 2005;3:601–610. - PubMed
    1. Carballido-López R, Formstone A, Li Y, Ehrlich SD, Noirot P, Errington J. Actin homolog MreBH governs cell morphogenesis by localization of the cell wall hydrolase LytE. Dev Cell. 2006;11:399–409. - PubMed

LinkOut - more resources